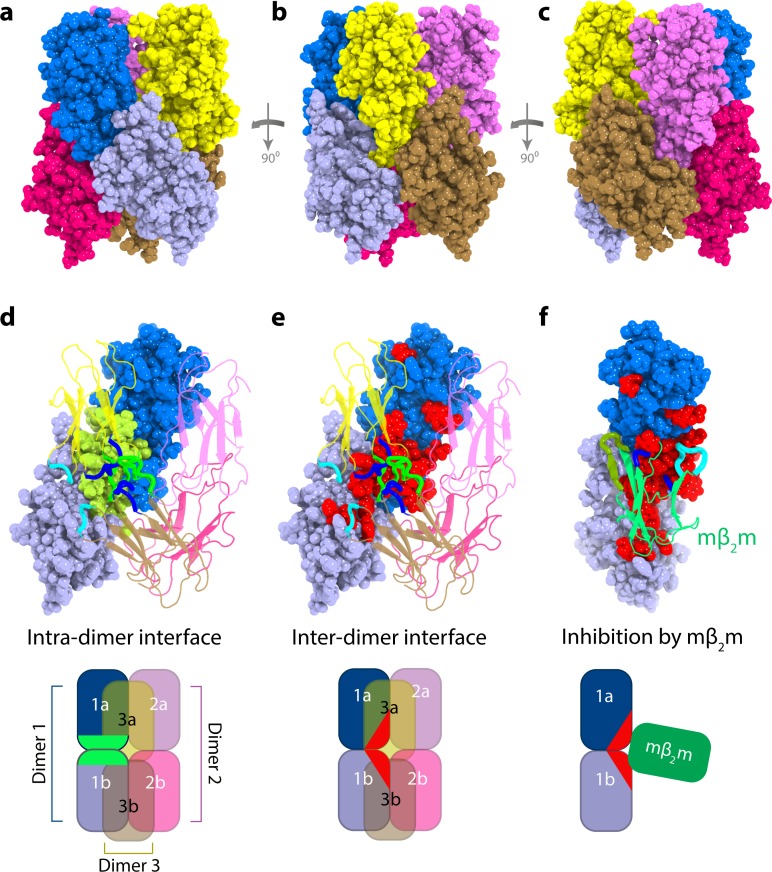
Figure 5. Structural model of ΔN6 hexamers.
(a–c) Sphere representations of the hexamer model formed from dimer A rotated by 90° in each view. Subunits belonging to the same dimer are colored in different tones of the same color. (d) The monomer-monomer (intra-dimer) interface is highlighted in green on the surface of the dimer formed from subunits 1a and 1b (within dimer A), with the other dimers shown as cartoons. (e) The inter-dimer interface is colored red on the surface of the dimer formed from subunits 1a and 1b, with the dimers shown as cartoons. (f) As in (e), but showing the dimer formed from subunits 1a and 1b, superposed with the mβ2m subunit in the inhibitory ΔN6-mβ2m dimer (Karamanos et al., 2014) (green cartoon). The ΔN6-ΔN6 and ΔN6-mβ2m dimers were aligned on the ΔN6 subunit 1b. Schematics of the assemblies are shown at the bottom colored as in (d–f). Note that the BC, DE and FG loops are highlighted as thicker chains in blue, green and cyan, respectively, in d-f. PDB files are publicly available from the University of Leeds depository (https://doi.org/10.5518/329). See also Video 2.

