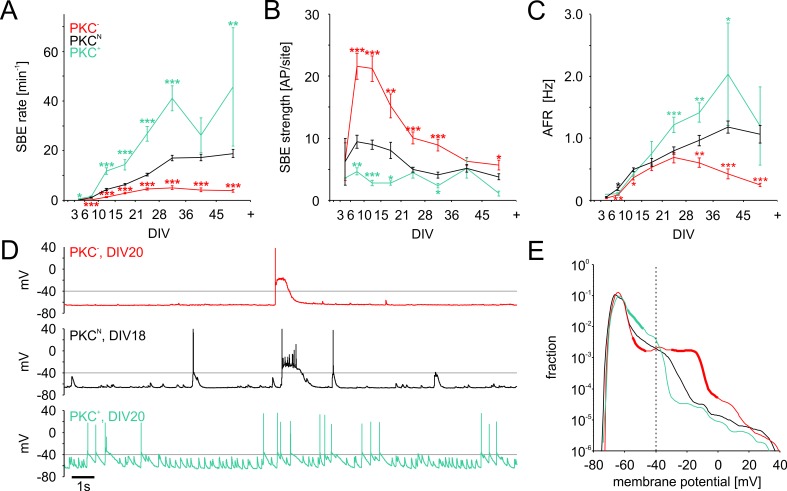
Figure 4. Development of spontaneous network activity.
(A) SBE rates gradually increased during development until 28 DIV, which was accelerated in clustered PKC+ networks and decelerated in homogeneous PKC− networks. In result, SBE rates differed considerably in mature networks and increased with the degree of clustering. X-axis ticks indicate bin boundaries. (B) PKC− networks generated stronger SBEs with more APs per site than clustered networks, compensating lower SBE rates to some extent. Burst strength increased initially but declined later on, putatively because of the maturation of inhibition. (C) AFR increased comparably during early development in the different PKC conditions, indicating that stronger bursting compensated lower SBE rates. Later in development, AFRs were increased in PKC+ and reduced in PKC− networks. (D) Neurons in PKC− networks showed strong depolarization during SBEs that reached well above the spiking threshold around −40 mV causing depolarization block of spiking. In clustered networks, neurons displayed higher membrane potential fluctuations below threshold that occasionaly passed the threshold leading to spikes. (E) Membrane potential distribution. Thick lines indicate regions significantly different from PKCN (p≤0.05). The fraction of time in which neuronal membrane potentials were above the spiking threshold (dashed line) was significantly increased in PKC− networks compared to PKCN and PKC+ networks. Data in A-D and F show mean ± SEM derived from 1 hr recording sessions. Asterisks indicate p-values ≤0.05 (*), ≤0.01 (**) and ≤0.001 (***) tested against PKCN. The number of recordings per age and condition is provided in Table 2.


