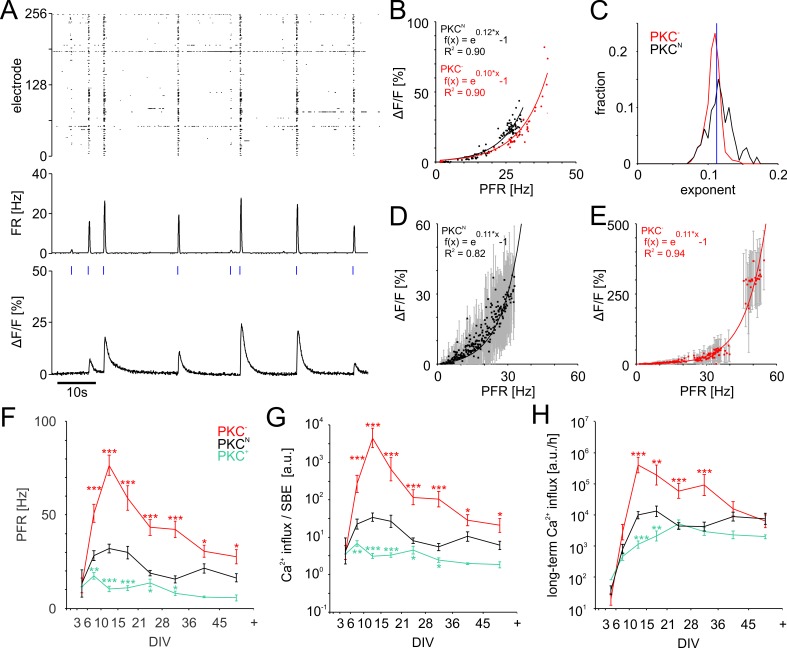
Figure 5. PFR-dependent Ca2+ gain.
(A) Spiking raster and firing rate averaged across all electrodes within 40 ms bins (synchronized to the frame times of the Ca2+ measurement) and Ca2+ signal for one neuronal soma at 19 DIV in a PKCN network. Blue ticks: SBE onsets. (B) The amplitude of Ca2+ transients (shown for the PKCN neuron in A and a PKC− neuron at 20 DIV) scaled exponentially (solid line) with PFR. (C) Exponents had a narrow distribution and were slightly higher in PKCN (p=3.2*10−18) than in PKC− conditions (PKCN: 179 neurons, 5 networks at 19 DIV, 714 SBEs total, mean and standard deviation of exponent = 0.12 ± 0.02; PKC−: 622 neurons, 4 networks at 20 DIV, 248 SBEs total, exponent = 0.11 ± 0.01). Blue: average exponent (0.11 ± 0.01) for the entire data set. (D) Ca2+ amplitudes scaled exponentially with PFRs across many neurons in these PKCN and PKC− networks (E). The data represent median (data points) and standard deviation (error bars) of Ca2+ amplitudes, averaged across neurons for a given PFR range (bin size 0.1 Hz). (F) PFR assessed during SBEs were higher in homogeneous networks and lower in clustered networks. PFR decreased after week 3, putatively with the maturation of inhibition. (G) Prediction of the development of average Ca2+ influx per SBE estimated as (Figure 5D). (H) Average Ca2+ influx per minute, estimated from all SBEs in 1 hr recording sessions, suggests that long-term average Ca2+ influx in different PKC conditions converged at network maturation. Data in G and H are presented as mean ± SEM. Asterisks indicate p-values ≤0.05 (*), ≤0.01 (**) and ≤0.001 (***) tested against PKCN.

