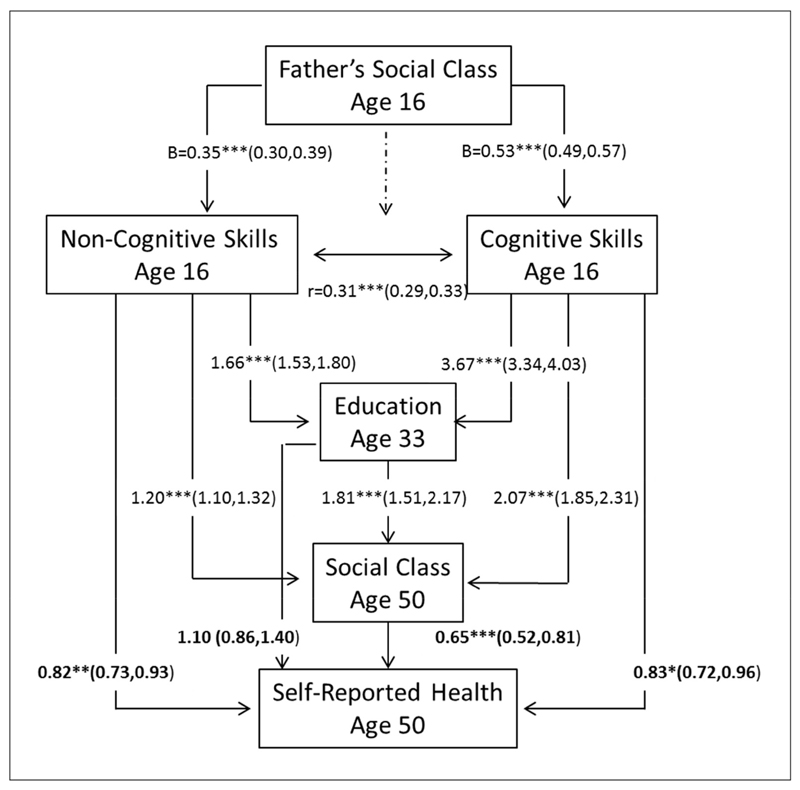
Fig. 2.
Path diagram of life course pathways linking non-cognitive skills and cognitive skills to self-reported health at age 50, with pathways to health labelled in bold. All parameters are odds ratios except for pathways labelled as “B”, which are unstandardised linear coefficients. For clarity of presentation, pathways linking father's social class at age 16 across the life course are partially displayed with an unlabelled dashed arrow. All pathways are fully adjusted for gender, maternal age at delivery, birth weight, parity, smoking during pregnancy, maternal marital status at birth, disability by age 16, ever in local authority care by 16, and missing more than a month of school at age 16 for ill health. ***p < 0.001, **p < 0.01, *p < 0.05.

