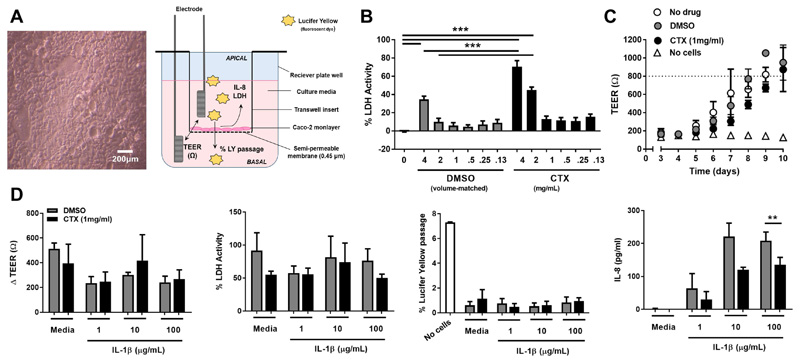
Figure 6. Cotrimoxazole reduces in vitro IL-8 production by gut epithelial cells under inflammatory conditions.
(A) Light microscopy of confluent Caco-2 monolayer (200 μm scale bar) and diagram showing transwell culture model. (B) Percentage lactose dehydrogenase activity relative to lysed cells (%LDH) of Caco-2 cultured for 24h with titrated concentrations of cotrimoxazole (CTX; black bars) or volume-matched DMSO control (grey bars); %LDH compared to untreated controls and between volume-matched pairs of cotrimoxazole and DMSO by adjusted Tukey’s test; ***p<0.001. (C) Daily trans-epithelial resistance (TEER) in transwell Caco-2 cultures without drug (white circles), 1 mg/mL cotrimoxazole (black circles) or DMSO (grey circles) relative to transwells without Caco-2 (no cells; white triangles); mean ±SEM, n=3 separate experiments. Dotted line indicates culture confluence (TEER≥800Ω). (D) Epithelial cell functions (Δ TEER, % LDH, % apical-to-basal passage of Lucifer Yellow dye relative to transwells without Caco-2 cells, and IL-8 concentration in apical supernatants) of confluent Caco-2 monolayers treated with 1 mg/mL CTX or DMSO since seeding, then incubated with media alone (no stimulus) or IL-1β for 24h; mean ±SEM, n=3 separate experiments. Cotrimoxazole and DMSO-treatment compared by 2-tailed t-tests; *p<0.05, **p<0.01

