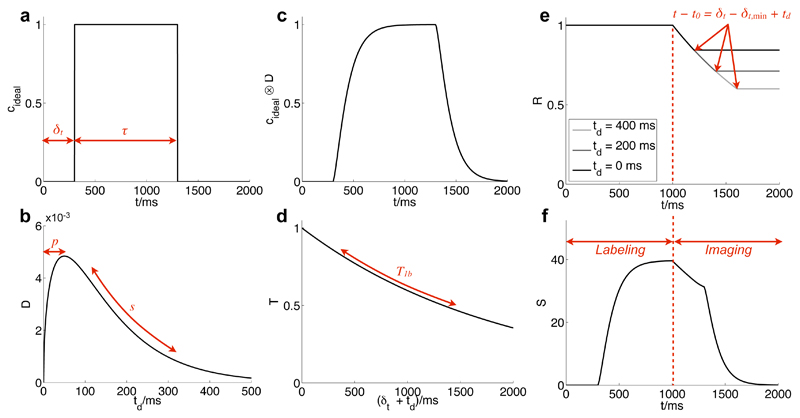
Figure 1.
Illustration of the various factors which contribute to the final kinetic model describing the ASL signal evolution in a single voxel: the ideal labeled blood concentration is a rect function (a); convolution with a dispersion kernel (b) yields a modified curve (c); account must also be taken of T1 decay (d) and effects due to the RF excitation pulses (e, plotted for three different td values). Note that RF effects are not present before the start of imaging and the curve flattens out to a constant when the time relative to the start of imaging is greater than the time the blood has spent in the imaging region (which varies with td). Combining these effects yields the final model curve (f) which is also scaled by S0 and blood volume. For long labeling durations (τ > δt) only the latter portion of the curve will be observed (as shown in (f)) since imaging cannot commence until the labeling has finished. Parameters used for these plots: A = 50, δt = 300 ms, s=0.01ms-1,p=50ms,δt,min =100ms.

