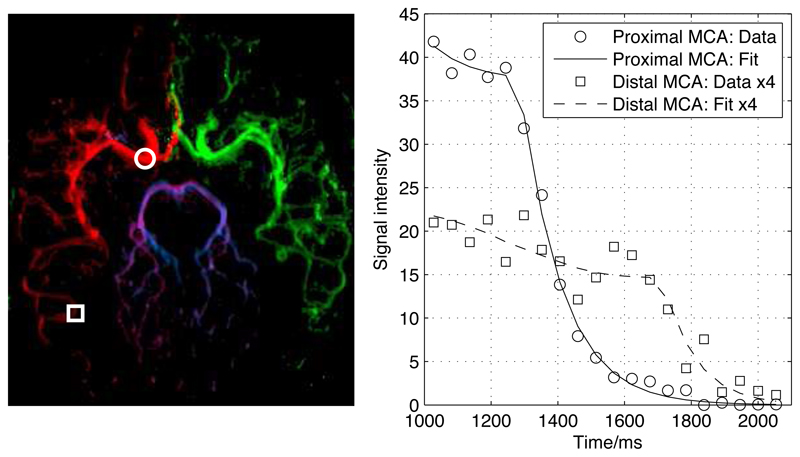
Figure 2.
Examples of the model fit to the data in a healthy volunteer using the transverse view. Two locations in the proximal (circle) and distal (square) right MCA are overlaid on the color coded map of A (left): RICA = red, LICA = green, RVA = blue, LVA = purple. The corresponding time series and model fit at these locations to the right ICA component are also shown (right). The time axis is relative to the start of the VEPCASL pulse train.

