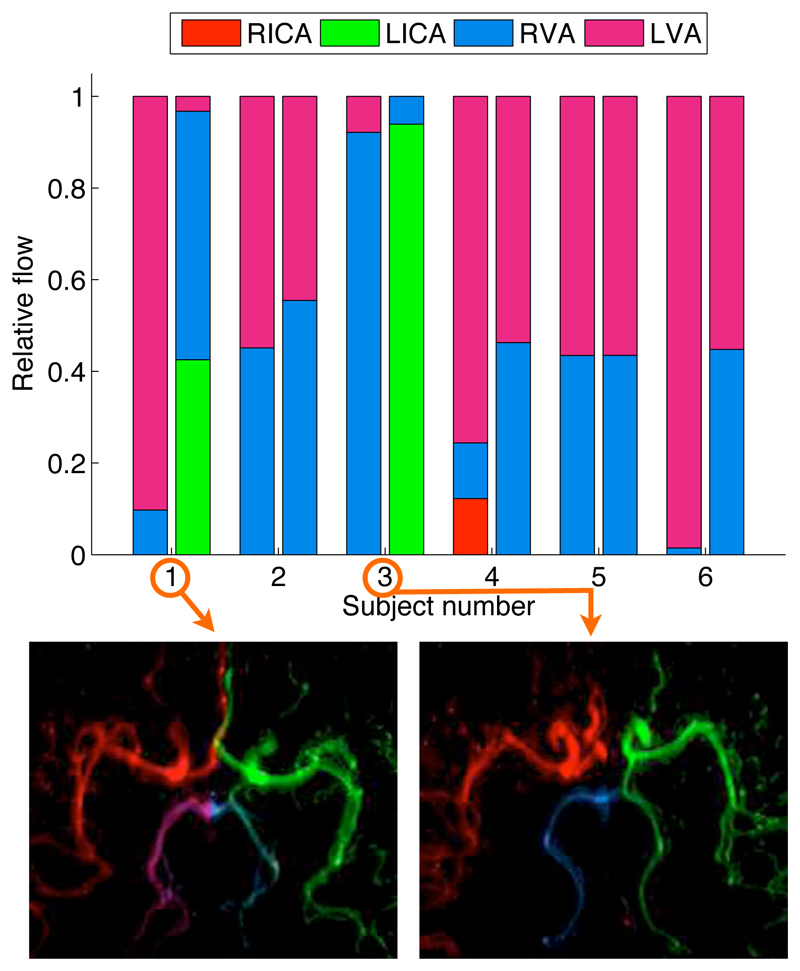
Figure 5.
Relative blood volume flow rate calculations in the PCAs of healthy volunteers in the transverse view. The stacked bar chart shows the relative blood flow contributed by each of the feeding arteries (see legend) in both the RPCA (left bar) and LPCA (right bar) for each subject. For the two subjects (1 and 3) with the greatest degree of collateral flow the corresponding map of A is shown underneath, demonstrating clear filling of the left posterior communicating arteries.

