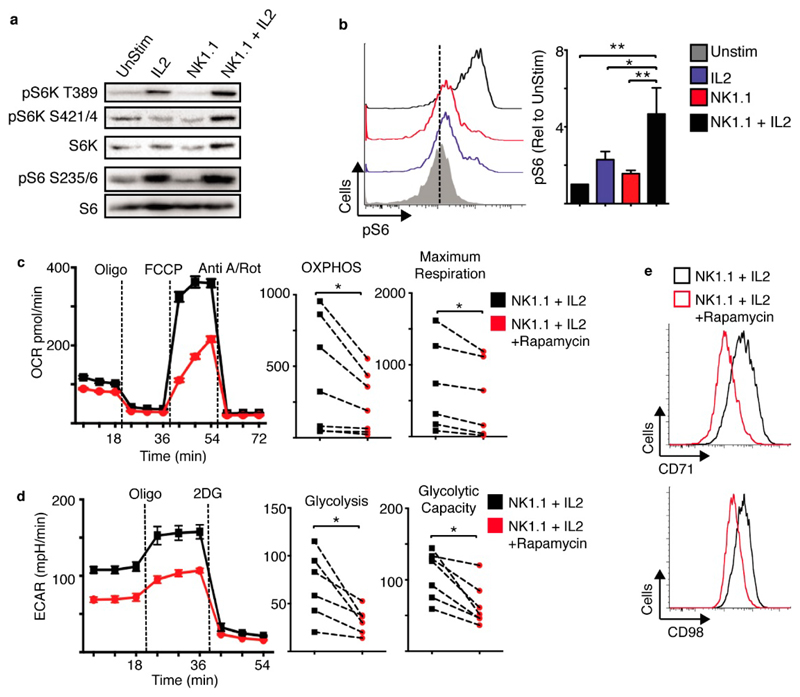
Figure 5. mTORC1 is required for NK1.1 plus IL2-induced NK cell metabolism.
(a–e) Cultured NK cells (6 days in IL15 10 ng/mL) were purified and stimulated with a plate bound α-NK1.1 antibody (10 μg/mL) in media supplemented with low dose IL15 (5 ng/mL) ± IL2 (20 ng/mL) ± rapamycin (20 nM) as indicated, or left unstimulated (IL15; 5 ng/mL). Cells were analysed by immunoblot analysis (a), by flow cytometry for levels of phosphorylated S6 ribosomal protein (pS6) (b), or the expression of CD71 and CD98 (e). Alternatively, rates of OXPHOS (c) or glycolysis (d) were measured using the seahorse extracellular flux analyser. Data is representative (a–e) or mean ± SEM (b–d) of 5–6 independent experiments. Data was analyzed using a one way ANOVA and tukey post test (b), a paired students t-test (c,d) (* p < 0.05, ** p < 0.01).

