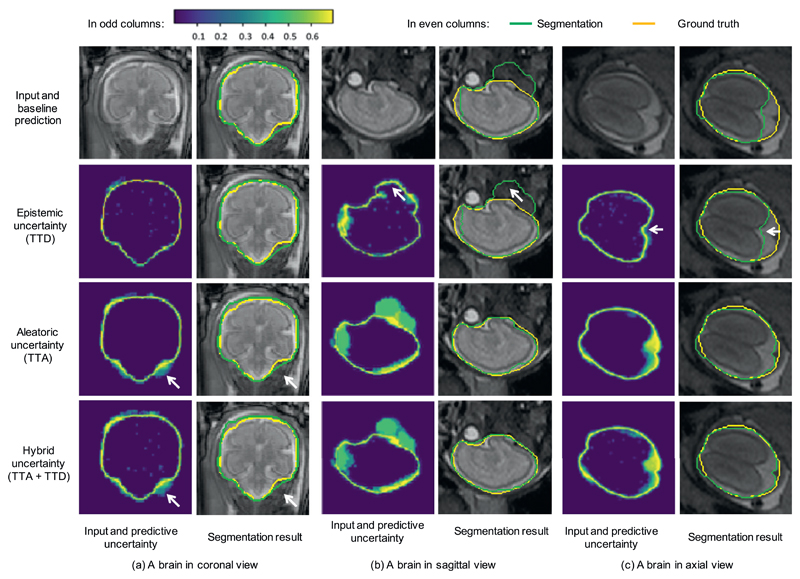
Fig. 1.
Visual comparison of different types of uncertainties and their corresponding segmentations for fetal brain. The uncertainty maps in odd columns are based on Monte Carlo simulation with N = 20 and encoded by the color bar in the left up corner (low uncertainty shown in purple and high uncertainty shown in yellow). The white arrows in (a) show the aleatoric and hybrid uncertainties in a challenging area, and the white arrows in (b) and (c) show mis-segmented regions with very low epistemic uncertainty. TTD: test-time dropout, TTA: test-time augmentation. (For interpretation of the references to color in this figure legend, the reader is referred to the web version of this article.)

