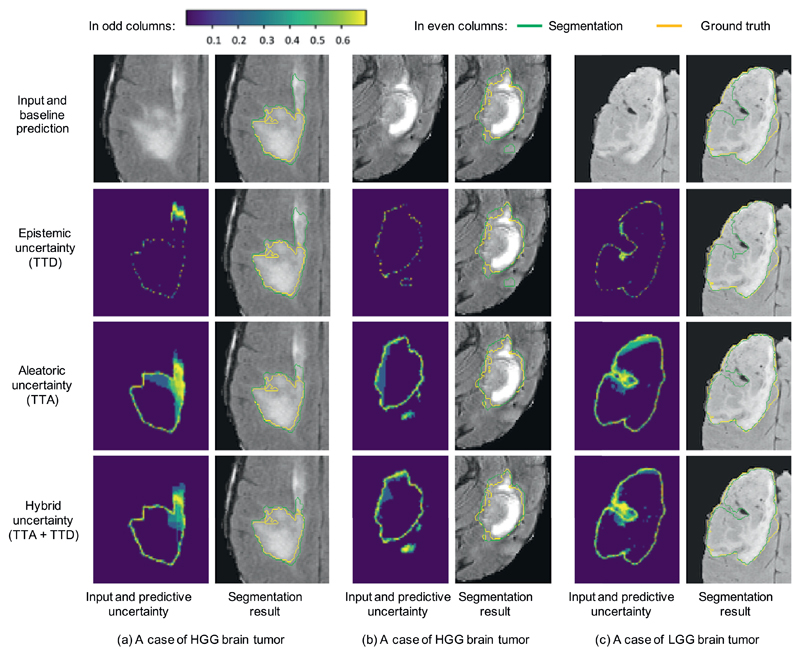
Fig. 6.
Visual comparison of different testing methods for 3D brain tumor segmentation. The uncertainty maps in odd columns are based on Monte Carlo simulation with N = 40 and encoded by the color bar in the left up corner (low uncertainty shown in purple and high uncertainty shown in yellow). TTD: test-time dropout, TTA: test-time augmentation. (For interpretation of the references to color in this figure legend, the reader is referred to the web version of this article.)

