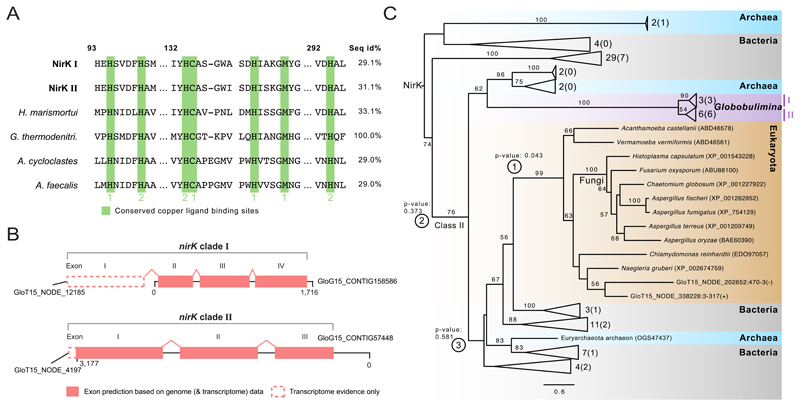
Figure 3. Sequence and phylogeny of the Globobulimina nitrite reductase (NirK).
See also Figure S1, Tables S2–S5 and Data S1, S2. A) Sequence conservation of copper ligand binding sites in Globobulimina NirK. Copper ligand binding sites are highlighted in green. Type 1 or 2 copper binding sites are indicated. Column numbers refer to the corresponding sequence positions in the Geobacillus thermodenitrificans sequence. ‘Seq id%’ refers to the local alignment sequence identity compared to Geobacillus thermodenitrificans (100 %). For details and the complete alignment see Data S1B. B) Gene structure in Globobulimina nirK clades based on genomic contigs. Dashed lines indicate regions that are supported by transcriptome assembly but were not covered by genomic contigs. Although the automatic annotation of both genomic representatives of Globobulimina NirK was predicted to encode complete N-termini, homology to predicted transcriptome contigs indicate an incomplete gene start. C) Collapsed phylogenetic tree of Globobulimina NirK. Colour coding indicates taxonomic classification where two Globobulimina clades (clade I and II) are highlighted and form a monophyletic clade. The number of sequences represented by collapsed branches is shown next to the corresponding triangles. (The number of sequences derived from the current study is indicated in brackets.) Alternative tested topologies of the Globobulimina clades are indicated by circled numbers (① Grouping of the Globobulimina clade with other eukaryotes in contrast to all remaining sequences in the tree. ② The Globobulimina clade groups independently from NirK class II clade. ③ Grouping of the Globobulimina clade with a eukaryote-containing subclade of NirK class II). For more details and the complete phylogeny see Data S2B. The tree was rooted with the MAD method. Bootstrap support values using 100 replicates (>50) are denoted at the branches. The scale bar refers to substitutions per site.

