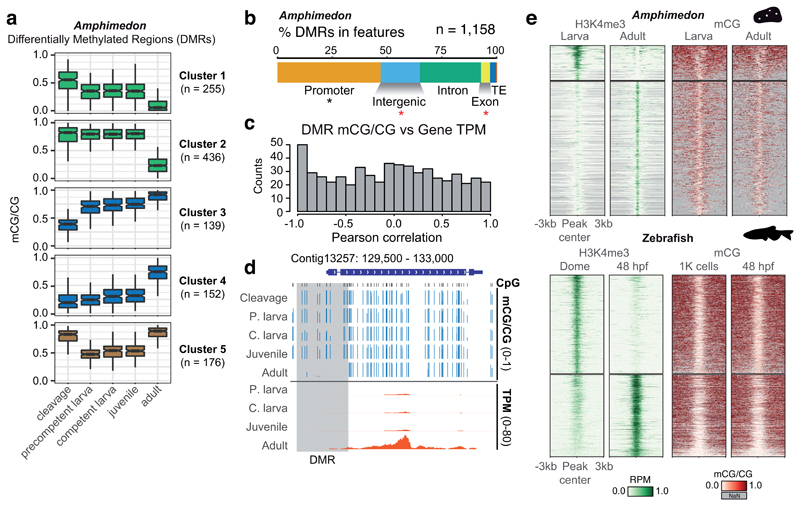
Figure 3. Methylation dynamics during Amphimedon development.
(a) K-means clustering of Differentially Methylated Regions (DMRs) (ΔmCG ≥ 0.4) throughout Amphimedon development, coloured by directionality of mCG change over time (green = decrease; blue = increase, brown = transient decrease in mid-developmental stages). Boxplot centre lines are medians, box limits are quartiles 1 (Q1) and 3 (Q3), whiskers are 1.5 × interquartile range (IQR) and points are outliers. (b) Intersection of DMRs with genomic features in Amphimedon. An asterisk indicates p < 0.01 in a two-sided Fisher’s exact test between the DMRs and expected, in black enrichment against genomic background, in red depletion. (c) Distribution of Pearson correlation values between DMR mCG level and the transcript abundance (TPM) of the associated gene(s) for each developmental stage. (d) Genome browser representation of a DMR situated in a promoter displaying strong anti-correlation between DMR methylation and gene transcript abundance. (e) Heatmap of H3K4me3 ChIP-seq signal (Reads Per Million, RPM) and methylation levels in differential H3K4me3 peaks in Amphimedon and zebrafish.

