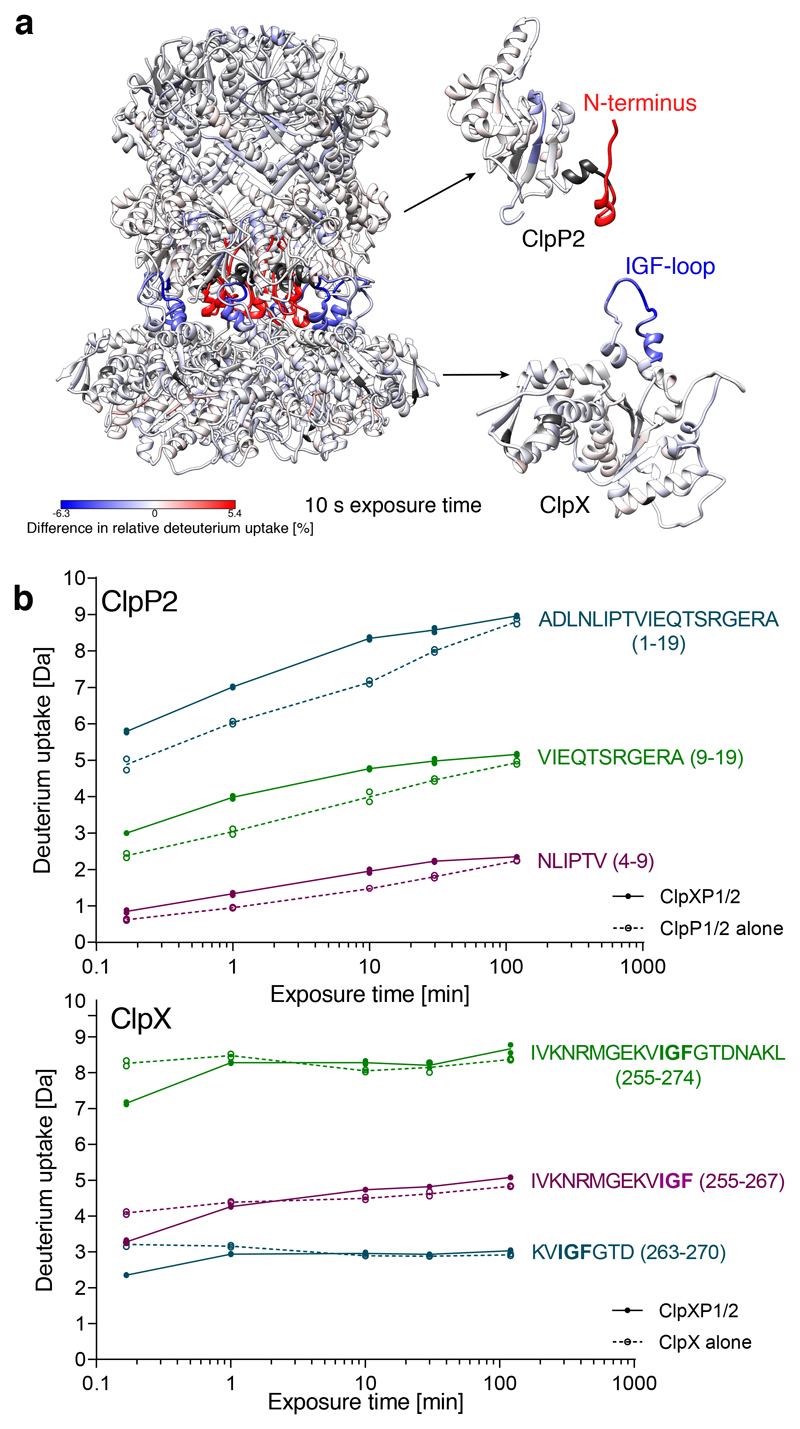
Figure 4. HDX-MS analysis of ClpXP1/2 complex formation.
a) Difference in relative deuterium uptake after 10 s exposure is mapped on the structure of ClpXP1/2 (left), ClpP2 monomer (right top) and ClpX monomer (right bottom). Increased deuterium uptake upon complex formation is shown in red, decreased deuterium uptake is depicted in blue. Dark gray represents no coverage. The MS data are available online as source data. b) HDX kinetics of exemplary peptides in the N-terminus of ClpP2 (top) and in the IGF-loop of ClpX (bottom). Solid lines and filled circles represent the ClpXP1/2 complex, dashed lines and empty circles represent ClpP1/2 or ClpX. Two independent replicates are shown, lines denote the mean.

