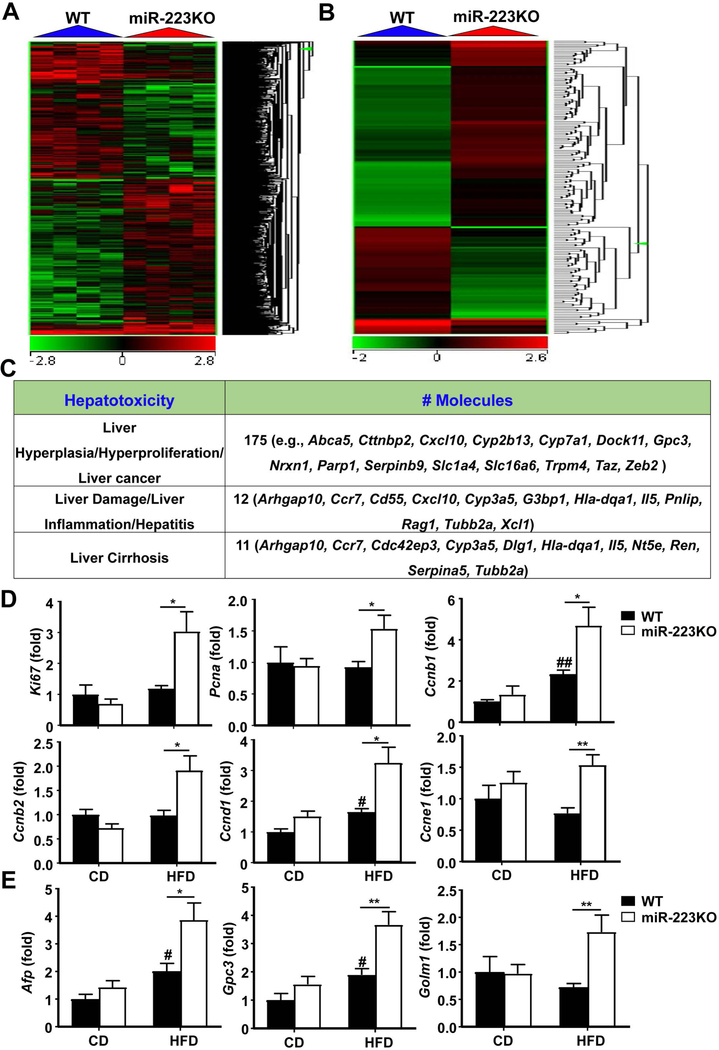
Figure 4. Upregulation of hepatocarcinogenesis-related genes in miR-223KO mice versus WT mice after 3m-HFD feeding.
WT and miR-223KO mice were fed an HFD or CD for three months. Liver tissue samples were collected, and then subjected to microarray analysis. (A) Heat map of gene expression (>2-fold changes) from microarray analysis is shown. (B) Heat map of 172 liver cancer-related genes expression from microarray analysis is shown. (C) Ingenuity Pathway Analysis of liver cancer, inflammation, and cirrhosis in WT and miR-223KO mice. (D) RT-qPCR analyses of hepatic proliferation markers. (E) RT-qPCR analyses of HCC markers. Values represent means ± SEM (n=4 in panels A-C; n=8 in panels D-E). *P< 0.05, **P< 0.01 in comparison with WT HFD groups; #P<0.05, ##P<0.01 in comparison with WT CD groups.

