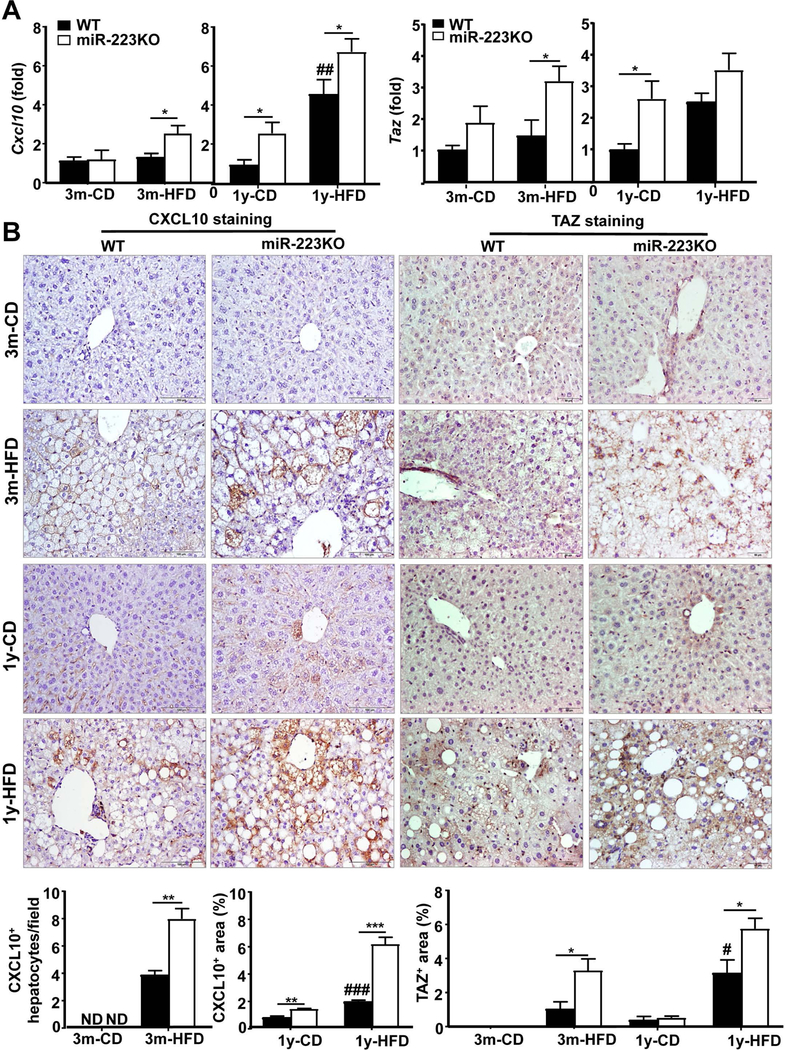
Figure 6. A greater number of hepatocytes strongly expressed CXCL10 and TAZ in HFD-fed miR-223KO mice versus WT mice.
WT and miR-223KO mice were fed an HFD or CD for three months or one year. (A) Liver tissues were collected for RT-qPCR analyses of Cxcl10 and Taz. (B) Liver tissues were also subjected to immunohistochemistry analyses. Representative CXCL10 staining and TAZ staining of liver tissue sections. Quantification of CXCL10+ hepatocytes or CXCL10+ area and TAZ+ area per field was quantified. Values represent means ± SEM (n=8–12). *P< 0.05, **P<0.01, ***P< 0.001 in comparison with corresponding WT groups; #P<0.05, ##P<0.01, ###P<0.001 in comparison with WT CD groups.

