
Figure 8.
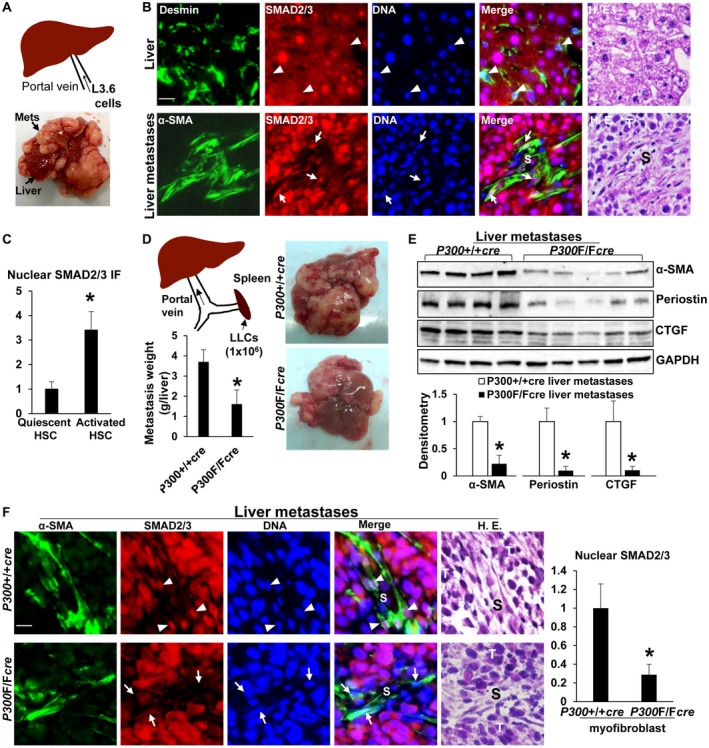
Nuclear SMAD2/3 in activated‐HSC/myofibroblasts of liver metastases are down‐regulated by cre‐mediated p300 gene disruption. (A) Illustration of portal vein injection of L3.6 cells. (B,C) SMAD2/3 were assessed in liver and isolated liver metastases using IF simultaneously with antibodies against Desmin (marker for quiescent HSCs) or α‐SMA (marker for activated HSCs). Nuclear SMAD2/3 were more increased in activated‐HSC/myofibroblasts (arrows) than in HSCs (arrowheads). *, P < 0.05 by t test, n > 26 cells per group. (D) Illustration of intrasplenic injection of LLCs. LLCs formed fewer liver metastases in p300F/Fcre mice than in p300+/+cre mice. *, P < 0.05 by t test, n = 5, 5. (E) Isolated liver metastases were lysed for WB. p300F/Fcre liver metastases contained reduced α‐SMA, periostin, and CTGF protein levels. *, P < 0.05 by t test, n = 4, 5. (F) Nuclear SMAD2/3 were reduced in p300F/Fcre myofibroblasts than in p300+/+cre myofibroblasts. *, P < 0.05 by t test, n > 40 cells per group. Bars in B and F, 20 µm. Abbreviations: GAPDH, glyceraldehyde 3‐phosphate dehydrogenase; HE, hematoxylin and eosin; S, stroma; T, tumor.