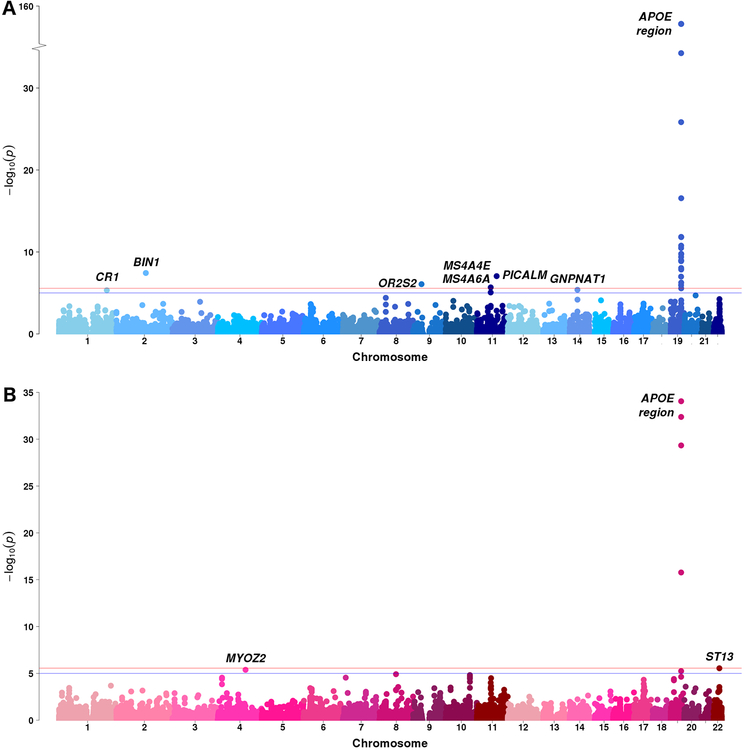
Fig. 2.
Manhattan plots of gene-based genome-wide association analyses in ADGC combined phase 1 and phase 2 samples of (A) the younger age (age 60–79 years, N = 11,358) and (B) the older age (age ≥ 80 years, N = 4,801). The red line denotes the gene-based genome-wide significance level of P value = 2.73×10⁻⁶ and blue line denotes the suggestive level of P value = 2.73×10⁻⁶. The gene symbols are shown here if their P values calculated by gene-based analyses are less than the suggestive level. APOE region is shown as representatives of significant genes on chromosome 19.

