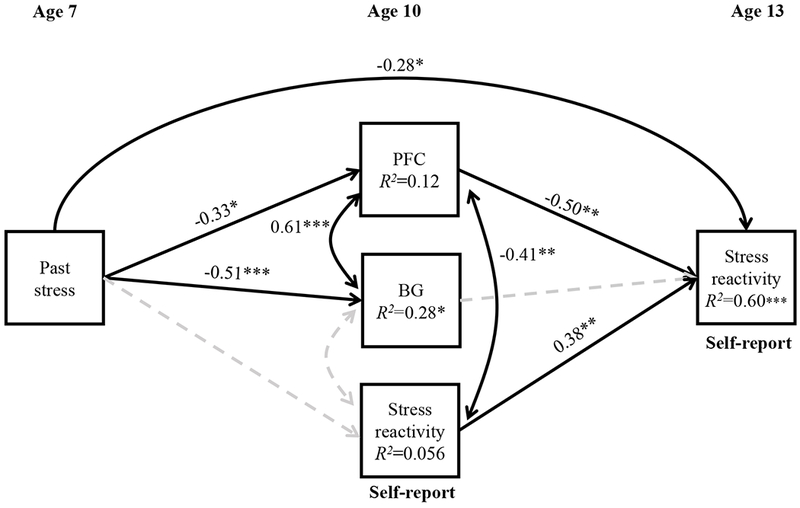
Figure 6.

Path analysis of the relationship between past stress at age 7, response to reward anticipation at age 10 in prefrontal areas (PFC: average of mPFC and ACC), basal ganglia (BG: average of ventral caudate, NAcc, putamen and globus pallidus) and self-reported stress reactivity to the Speech task at ages 10 and 13. Significant paths with standardized coefficients (β) and correlations (r) are presented as straight and curved continuous lines respectively. Dashed and faded lines represent non-significance. R2, proportion of variance explained. *p<0.05, **p<0.01, ***p<0.001
