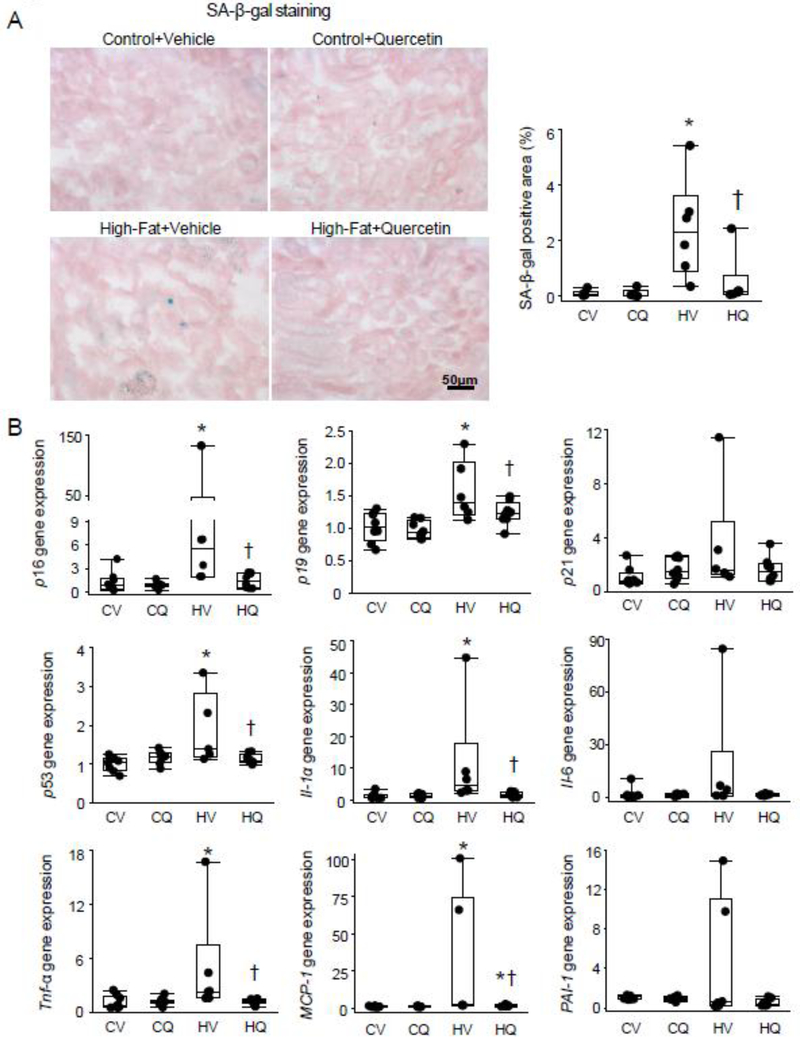
Figure 2.
Renal senescence in obese dyslipidemic mice. A. Representative renal senescence-associated β-galactosidase (SA-β-Gal) staining. SA-β-Gal+ area (blue) was larger in both High fat+Vehicle (HV) and High fat+Quercetin (HQ) groups than in controls, but lower in HQ. n=6 each; Wilcoxon test. B. Renal p16, p19, and p53 gene expression was upregulated in HV compared with Control+Vehicle (CV), and decreased in HQ. Renal gene expression of IL-1α, Tnf-α, and MCP-1 was increased in HV compared with CV and decreased in HQ compared with in HV. CV n=8, CQ n=8, HV n=6, HQ n=8; Wilcoxon test. *P≤0.05 vs. CV, †P≤0.05 vs. HV.

