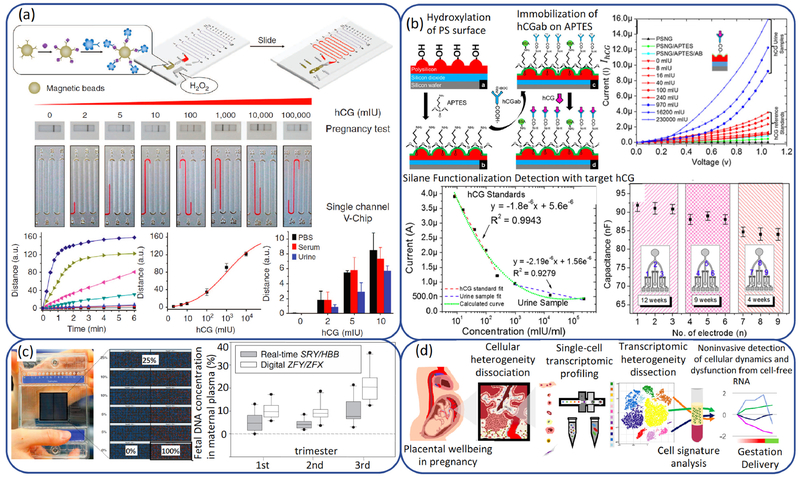
Fig 3.
(a) V-Chip hCG detection scheme and results. (Reprinted from Ref. (257) with permission of Nature.) (b) Schematic illustration of chemical functionalization on the PSNG surface, DC amperometric detection of hCG and reproducibility test of signal transduction on PSNG electrodes. (Reprinted from Ref. (258) with permission of PLOS.) (c) Frontal view of a microfluidics digital array with the digital readout of the accuracy experiment and box plots of male fetal-DNA percentages measured with the nondigital real-time SRY/HBB assay and the digital ZFY/ZFX assay. (Reprinted from Ref. (259) with permission of AACC.) (d) Schematic diagram showing single-cell transcriptomic profiling and the dissection of the cellular heterogeneity of human placenta. (Reprinted from Ref. (263) with permission of PNAS.)

