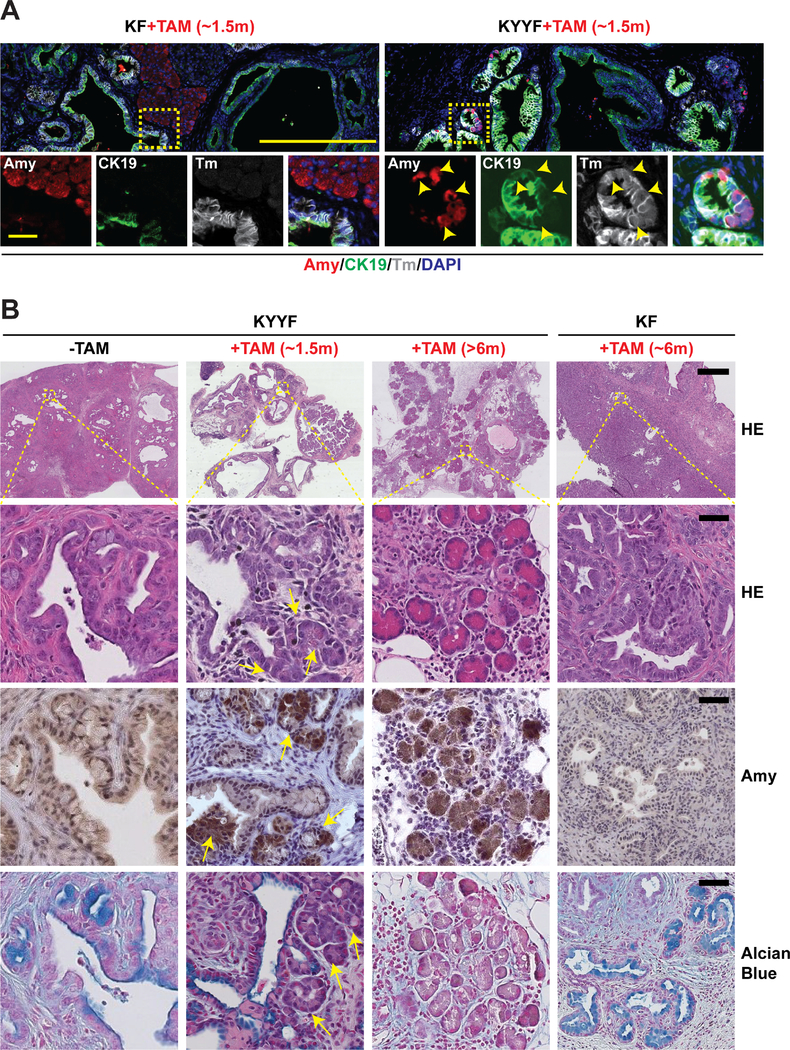
Figure 5. Yap loss induces gradual re-differentiation of Kras mutant neoplastic ductal cells into Amylase-secreting acinar-like cells and regeneration of pancreatic parenchyma.
(A) Representative images of IF staining for Amylase (Amy; red), CK19 (green), Tm (gray) and DAPI (blue) in KF and KYYF pancreata after ~1.5 months of TAM treatment. Yellow arrowheads indicate Amylase/CK19/Tm triple positive cells. Scale bars represent 500 μm (top) and 200 μm (bottom).
(B) Representative HE and IHC images of Amylase and Alcian Blue in KYYF pancreata before, after ~1.5 or >6 months of TAM treatment and KF pancreata after ~6 months of TAM. Yellow arrows mark the ductal/acinar transitional structures observed after short term TAM treatment. Scale bars represent 500 μm (top) and 25 μm (bottom).

