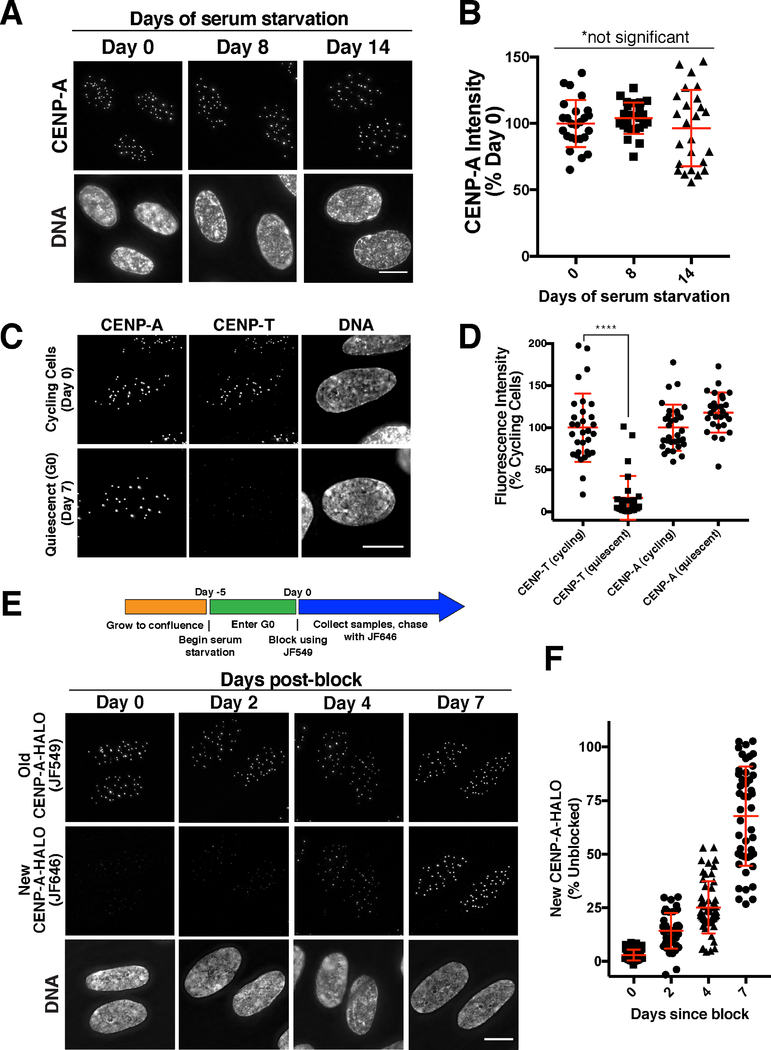
Figure 1. CENP-A is gradually incorporated in quiescent human somatic cells.
(A) Immunofluorescence images showing endogenous CENP-A in quiescent RPE-1 cells at 0, 8, and 14 days after entering serum-starvation induced quiescence. (B) Fluorescence quantification reveals that CENP-A levels remain constant during quiescence. Points represent the sum of all centromeres from an individual cell relative to Day 0. Error bars represent the mean and standard deviation of 25 cells/time point. The differences between time points are not statistically different based on a Welch’s t test. (C) Immunofluorescence in RPE-1 cells for CENP-T and CENP-A in quiescence vs. proliferation. (D) Fluorescence quantification reveals a reduction of CENP-T at centromeres in quiescence, whereas CENP-A levels remain constant. Points represent the sum of all centromeres from an individual cell relative to Day 0. Error bars represent the mean and standard deviation of 31 cells (cycling) or 28 cells (quiescent). ****p<0.0001 by Mann Whitney test. (E) Halo-tag CENP-A incorporation assay in quiescent cells. Schematic indicates experimental conditions. Images - Top: Old HALO-CENP-A visualized with JF549. Middle: New CENP-A-Halo visualized with JF646. Bottom: Corresponding DNA staining. (F) Quantification of new CENP-A-Halo fluorescent intensity relative to pre-existing CENP-A (see Experimental Procedures). Points represent the sum of all centromeres of individual cells. Error bars represent the mean and standard deviation of at least 40 cells. Scale bars = 10 μm.

