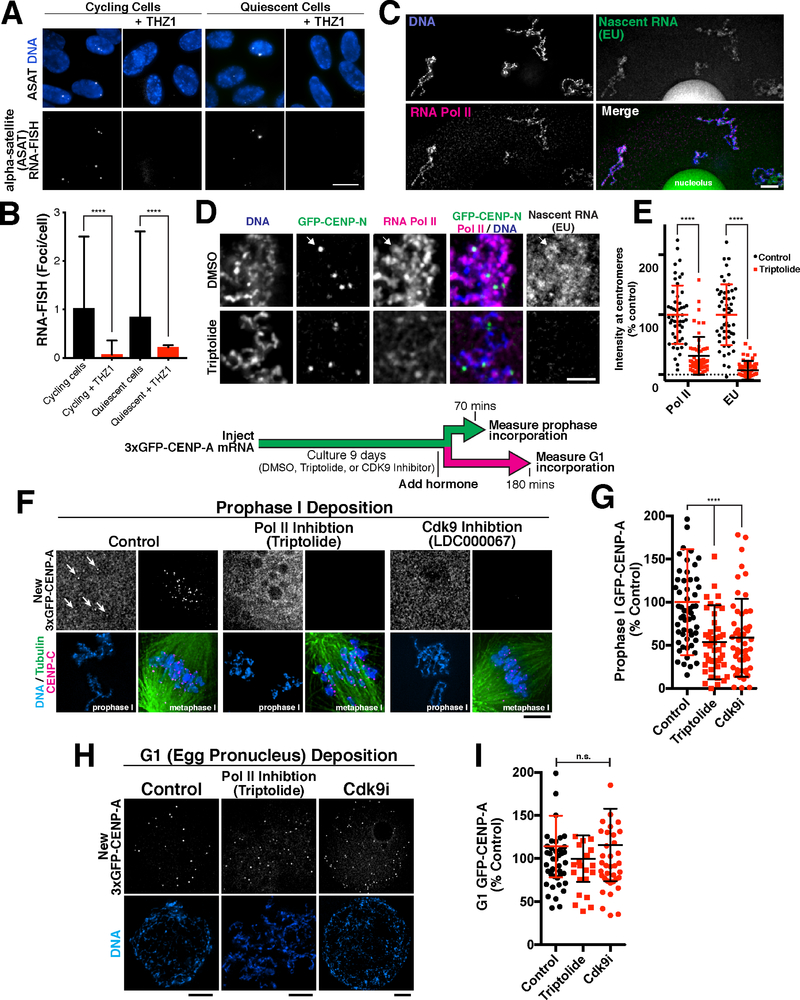
Figure 6. CENP-A deposition in quiescence involves RNA transcription.
(A) Single molecule RNA fish showing the presence of centromeric alpha satellite-derived transcripts in RPE-1 cells. Scale bar = 5 μm. (B) Quantification of transcript numbers. Transcripts are approximately equal in cycling and G0 quiescent cells, but decrease when treated with the Cdk7 transcription inhibitor THZ1. Error bars represent the mean and standard deviation (cycling n = 267 nuclei; cycling + THZ1 n = 113; quiescent n = 269; quiescent + THZ1 n = 183). ****p<0.0001 by Mann Whitney test. (C) Immunofluorescence for RNA Pol II and detection of nascent RNA synthesis by EU incorporation reveals ongoing transcription in prophase I arrested starfish oocytes. Scale bar = 5 μm. (D) Pol II and nascent RNA (EU) are present in the vicinity of centromeres, visualized with 3xGFP-CENP-N in arrested oocytes. Pol II and EU images are scaled equivalently. (E) Treatment with the Pol II inhibitor Triptolide reduces Pol II localization and EU levels at centromeres. Individual points represent the average fluorescence at all centromeres. Error bars represent the mean and standard deviation (control n = 51 oocytes, triptolide n = 57 oocytes, measured for both Pol II and EU). ****p<0.0001 by Mann Whitney test. (F) Immunofluorescence showing new CENP-A incorporation in quiescent oocytes. Inhibition of Pol II with 10 μM of triptolide, or Cdk9 with 1 μM of LDC000067 reduces incorporation of new 3xGFP-CENP-A in prophase after 9 days in culture. Incorporation occurs in prophase I, but oocytes were stimulated to enter meiosis I for visualization to condense chromosomes for clarity. Scale bar = 5 μm. Metaphase 3xGFP-CENP-A images are scaled equivalently, and prophase images are linearly scaled individually (G) Quantification of new 3xGFP-CENP-A incorporation relative to DMSO control. Each point represents the mean of all centromeres from one oocyte. Error bars represent the mean and standard deviation (control, n = 58; triptolide, n = 47; Cdk9i, n = 51). ****p<0.0001 by Mann Whitney test. (H) Inhibition with 10 μM triptolide or 1 μM LDC000067 during prophase I arrest and in meiosis does not alter incorporation of new 3xGFP-CENP-A in G1. Scale bars = 5 μm. (I) Quantification of 3xGFP-CENP-A incorporation relative to DMSO control. Each point represents the mean of all centromeres from one oocyte. Error bars represent the mean and standard deviation (control n = 42, triptolide n = 20, Cdk9i n = 38). Significance determined by Mann Whitney test.

