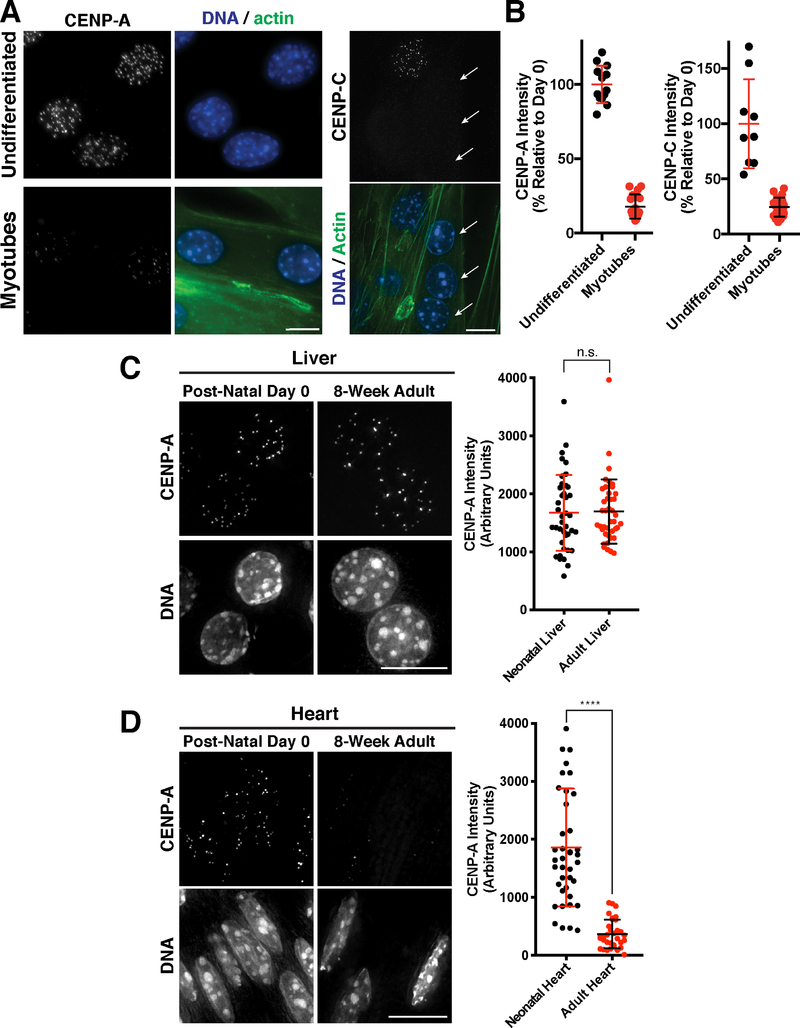
Figure 7. CENP-A levels decline in terminally differentiated muscle cells.
(A). Immunofluorescence images showing localization of CENP-A (left) and CENP-C (right) in mouse C2C12 cells that are either growing in culture (undifferentiated myoblasts) or were differentiated by serum starvation to form multi-nucleated muscle myotubes. Phalloidin staining is a marker for myotubes. Arrows indicate myotubule nuclei in the CENP-C experiments, whereas the other nuclei with CENP-C staining represents a quiescent, undifferentiated cell. Scale bar = 10 μm. (B) Quantification of CENP-A and CENP-C fluorescent intensity in either undifferentiated C2C12 cells or following myotube formation. (C) Immunofluorescence images of hepatocytes in post-natal day 0 or 8-week adult liver, showing CENP-A levels in vivo. Scale bar = 10 μm. Quantification of CENP-A fluorescence in hepatocytes normalized to ploidy as described in Experimental Procedures. Error bars represent the mean and standard deviation of N=40 post-natal hepatocytes, and N=41 adult hepatocytes. (D) Immunofluorescence images of cardiomyocytes in post-natal day 0 or 8-week adult heart, showing CENP-A levels in vivo. Scale bar = 10 μm. Quantification of CENP-A fluorescence in cardiomyocytes, where error bars represent the mean and standard deviation of N=40 post-natal cells, and N=33 adult cells. ****p<0.0001 by Mann Whitney test.

