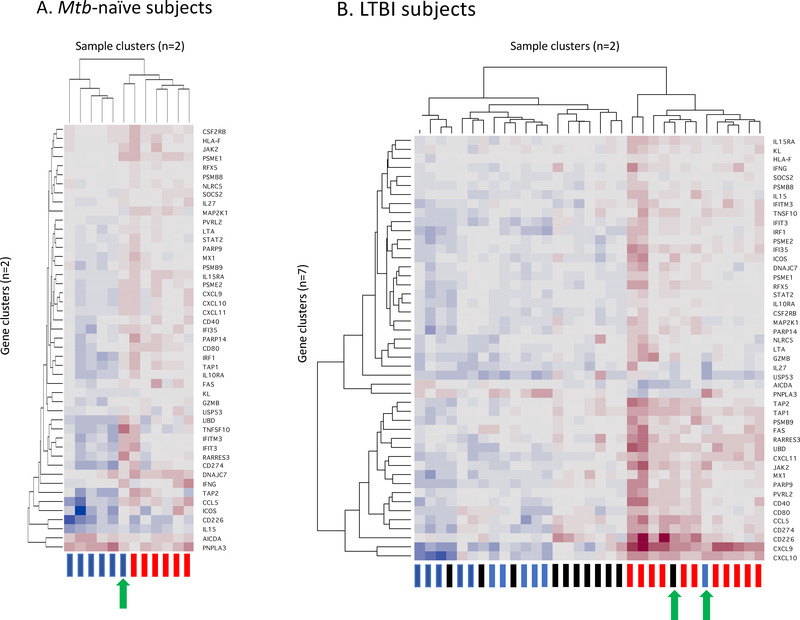
Figure 4:
Cluster analysis of expression of the 47 signature genes in Mtb-naïve subjects (4A) and individuals with LTBI (4B). Clustering was performed on a blinded basis according to patterns of responses of the 47-gene signature without regard to the study conditions of each sample. As illustrated in the y-axis of each figure, the clustering of the signature genes was substantially different in Mtb-naïve and LTBI subject groups, leading to the need to present the results in separate heat maps. As indicated on the x-axes, samples from each subject group were segregated into two clusters. In Mtb-naïve subjects (4A), uninfected samples are represented by blue rectangles, whereas Mtb-infected samples are indicated in red. This clustering effectively separates responses of uninfected vs Mtb-infected BAL cells, with the exception of one subject whose uninfected cells gave responses more typical of the Mtb-infected cells (green arrow). For each LTBI subject, three samples are represented, with blue again indicating unsorted, uninfected cells and red unsorted, Mtb-infected cells, whereas black rectangles indicate CD4-depleted, Mtb-infected BAL cells (4B). Despite the representation of three sample types, these responses remain classified into two clusters, reflecting that finding that Mtb-induced gene expression of the signature 47 genes following CD4+ T cell depletion was largely the same as that observed in unsorted, uninfected BAL cells of the same individuals. Unsorted Mtb-infected BAL samples from all 11 LTBI subjects segregated to the same cluster, which also included a single uninfected sample, as well as a single sample infected following CD4 T-cell depletion (green arrows). Of note, both of these “outlier” samples were from the same individual.

