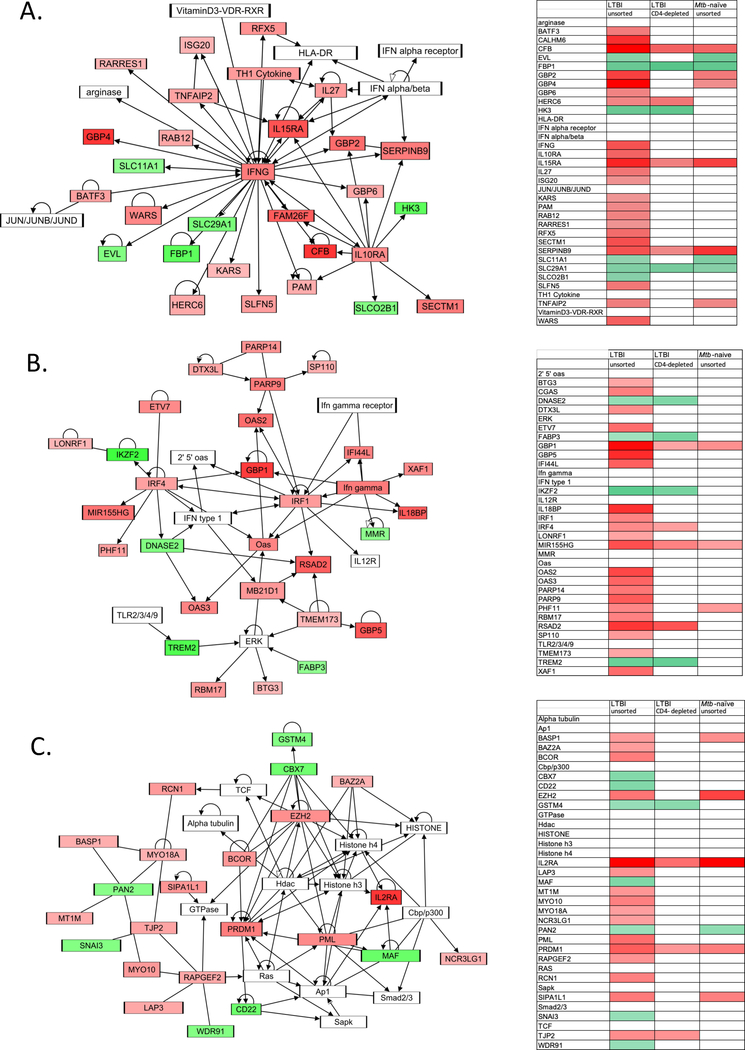
Figure 5.
The top networks identified through analysis of Mtb-induced BAL cell gene expression in LTBI subjects. Schematic figures illustrate gene interactions in these top 3 networks, A. “infectious diseases; endocrine system disorders; gastrointestinal diseases”, B. antimicrobial response; inflammatory response; cancer”, and C. “cellular function and maintenance, hematological system development and function; cellular development”. For each network figure (left), shading indicates degrees of significant upregulation (red) and downregulation (green) of gene expression in unsorted BAL cells from LTBI subjects. Heat maps to the right of each figure indicate Mtb-induced expression of all network genes in this condition, as well as in CD4-depleted cells of LTBI subjects and unsorted BAL cells of Mtb-naïve controls.

