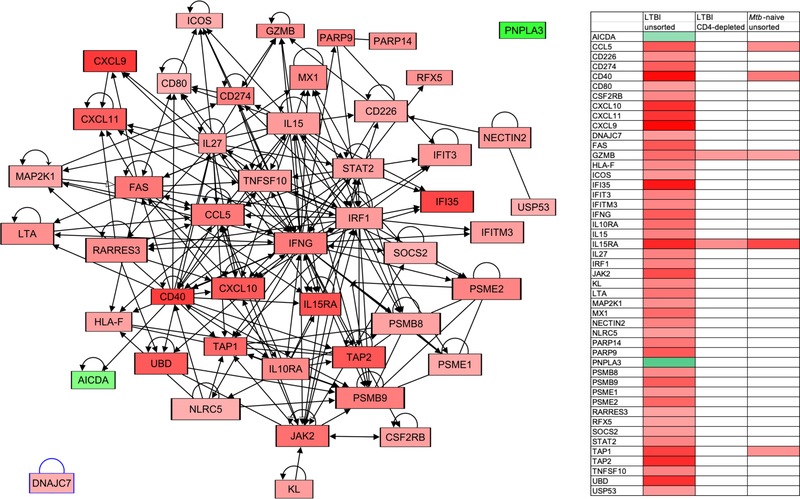
Figure 6:
Novel gene expression network representing the interrelationships of genes identified as the signature of CD4+ T-cell associated Mtb-induced gene expression in BAL cells from individuals with LTBI. Again, the figure represents gene expression in unsorted BAL samples from LTBI subjects; upregulated genes are represented with red shading and downregulated ones in green; as illustrated, all but 2 of the 47 genes within the identified signature have defined connections to a network that is centered on IFNγ. The associated heat map schematically compares expression of all network genes in this condition and in CD4+-depleted BAL cells from LTBI subjects and unsorted BAL cells from Mtb-naïve individuals using the same shading key. As indicted, significant Mtb-induced gene expression is almost completely absent within this network in these additional conditions.

