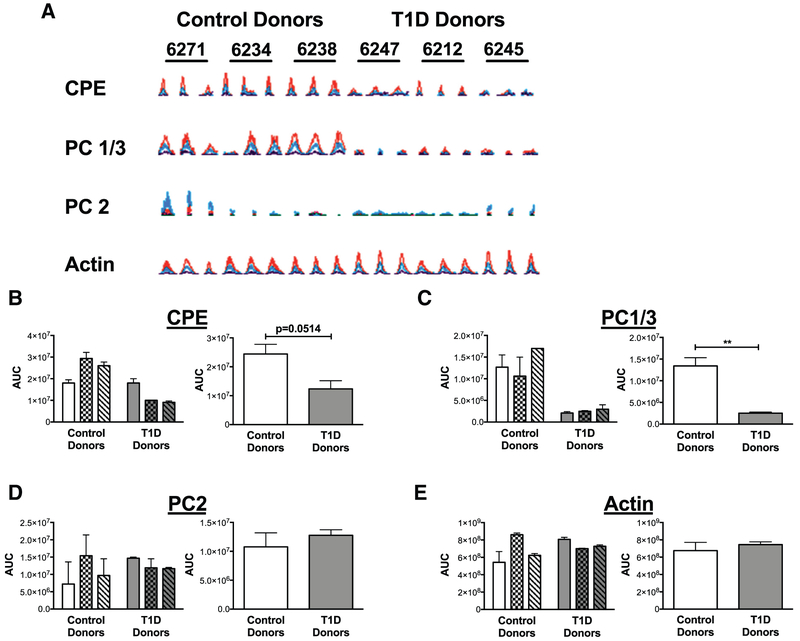
Fig 2.
Expression of CPE, PC1/3, and PC2 in LCM islets from nondiabetic controls and donors with type 1 diabetes (T1D). A, Extracted ion chromatograms of peptides from nondiabetic individuals (n = 3) compared to T1D donors (n = 3) with sequences AASQPGELK, ALVDLADPR, EELEEELDEAVER and AGFAGDDAPR from CPE, PC1/3, PC2, and actin, respectively. The Mascot identification ion and expect scores were significant for each of the 4 peptides. Expression of the individual peptides in each nPOD case (run as triplicates) is shown. nPOD case IDs are indicated above each set of triplicates. B-E, Quantitation of area under the curve (AUC) for chromatograms from each peptide is shown for each donor on the left, as well as in aggregate form on the right, with means and standard errors indicated. Aggregate means of control donors were compared to donors with type 1 diabetes using an unpaired t-test. (n = 3); **P <0.01 CPE, carboxypeptidase E; LCM, laser capture microdissection; nPOD, Network for Pancreatic Organ Donors with Diabetes; PC1/3, prohormone convertase 1/3; PC2, prohormone convertase 2.

