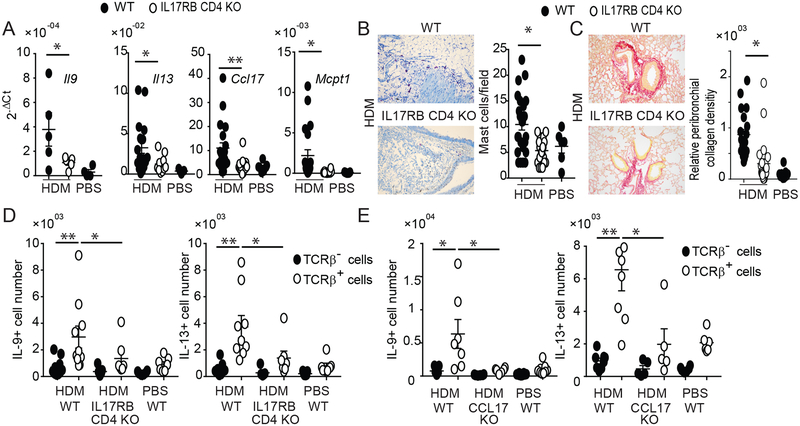
FIG 5.
IL-25 signaling in T cells drives HDM-induced type-2 inflammation in lungs. (A) Relative mRNA expression of genes as shown in HDM or PBS treated WT and IL-17RB CD4 KO mice. (B) Representative toluidine blue staining of lung (left) and total mast cell count (right) for mice and treatment as shown. (C) Representative Picro red staining of lung (left) and total relative peribronchial collagen density (right). For (A,B,C) data are the mean± sem of three independent experiments and a total of n=5–12 mice per group. For the mast cells and peribronchial collagen densisity, two fields per mouse were counted. (D, E) Numbers of IL-9- and IL-13-producing TCRβ+ and TCRβ- cells in lungs of HDM or PBS treated WT and IL-17RB-CD4 KO (D) and CCL17 KO mice (E), as indicated. Significance indicated for all TCRβ+ counts from HDM-treated mice and for TCRβ+/TCRβ- counts from WT mice. Data are the mean ± sem of two independent experiments with a total of n=7–9 (D) or n=5–7 (E) mice per group. *p<0.05; **p<0.01.

