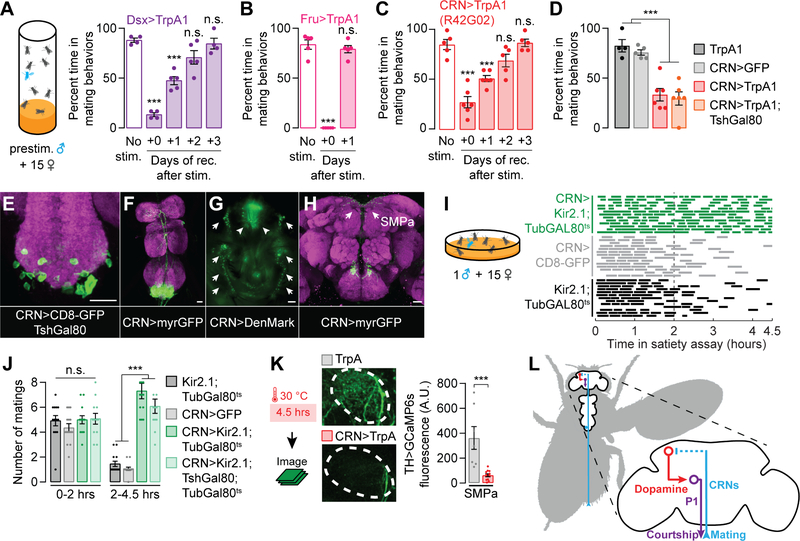
Figure 1. Copulation Reporting Neurons (CRNs) induce a persisting decrease in mating drive.
(A–C) Thermogenetic prestimulation (4.5 hrs) of all Doublesex (Dsx) neurons (A), all Fruitless (Fru) neurons (B), or the CRNs labeled by R42G02-Gal4 (C) induces an immediate loss of mating behaviors, but only the Dsx- and CRN-stimulated flies take days to recover from the stimulation (***p<0.001 compared to the no-stim group†, one-way ANOVA, A: n = 4–5 groups of 5–7 males, B: n = 5 groups, C: n = 5–6 groups). Throughout this figure, sexual activity was scored in the satiety assay (cartoon) to allow comparison with naturalistic satiety [22]. See Figure S1A for data using other Dsx-related Gal4 lines. (D) CRN-induced artificial satiety is not blocked by TshGal80, a Gal4 inhibitor expressed in many VNS neurons, allowing us to more closely approximate the relevant population within the VNS (one-way ANOVA, n = 4–6 groups of 5–7 males). (E–H) The CRNs have cell bodies in the abdominal ganglion (E-F)‡ and project dendrites (arrows) around the male’s external genitalia (arrowheads) (G), and axons to the top of the brain (H); neuropil in magenta. (I–J) Conditionally silencing the CRNs throughout the assay prevents satiety, which is most apparent in the second half of the assay (2–4.5 hours). This effect is not blocked by TshGal80 (one-way ANOVA, n = 12–14 males). Matings of individual flies are represented by dashes within single rows in I. (K) Thermogenetic stimulation of the CRNs decreases calcium activity (measured with GCaMP6s) in dopaminergic projections to the SMPa (t-test, n = 7–11 male brains). See Figure S1P for fluorescence data from an unrelated brain region. (L) A circuit model for how CRNs relay mating information to induce satiety. †*p<0.05, **p<0.01, ***p<0.001 for all figures. Error bars represent 1 S.E.M. in all figures. ‡Unless otherwise stated, all scale bars represent 20 µm. See Table S1 for the numbers of animals and experimental conditions used in each experiment. The image stacks for the max projections in this and other figures are uploaded to Mendeley Data.

