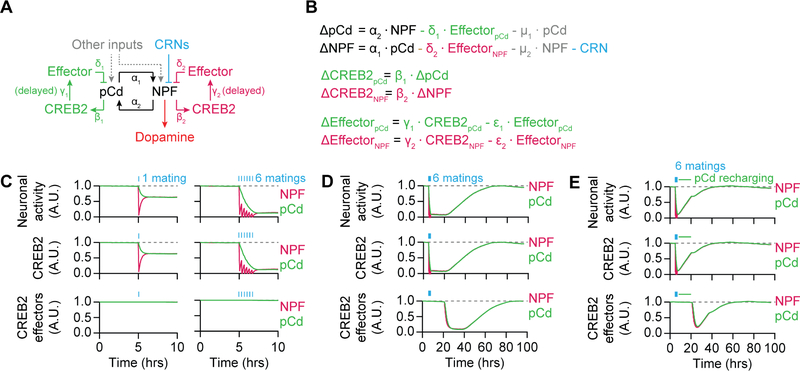
Figure 6. Modeling the circuit and molecular dynamics of mating drive.
(A–B) Representation (A) and implementation (B) of the model (see STAR Methods). (C) Left: A single mating immediately decreases electrical and CREB2 activity in NPF neurons, with a consequent but delayed reduction in pCd activity. CREB2 effectors are modeled as remaining high for several hours after CREB2 activity decreases. Right: 6 sequential matings cause a dramatic reduction in loop activity. See Figure S6A for model equilibration (D) After repeated matings (blue bars), both pCd and NPF neurons show decreased electrical and CREB2 activities, which then recover over 3 days. The presumed slow turnover in CREB2 effectors such as Task7 delays their removal relative to the decline in CREB2 transcriptional activity, postponing the recovery of electrical activity in the loop. (E) Stimulating pCd neurons (green line in legend) after 6 matings (blue bars) accelerates the recovery from satiety. See also Table S1.

