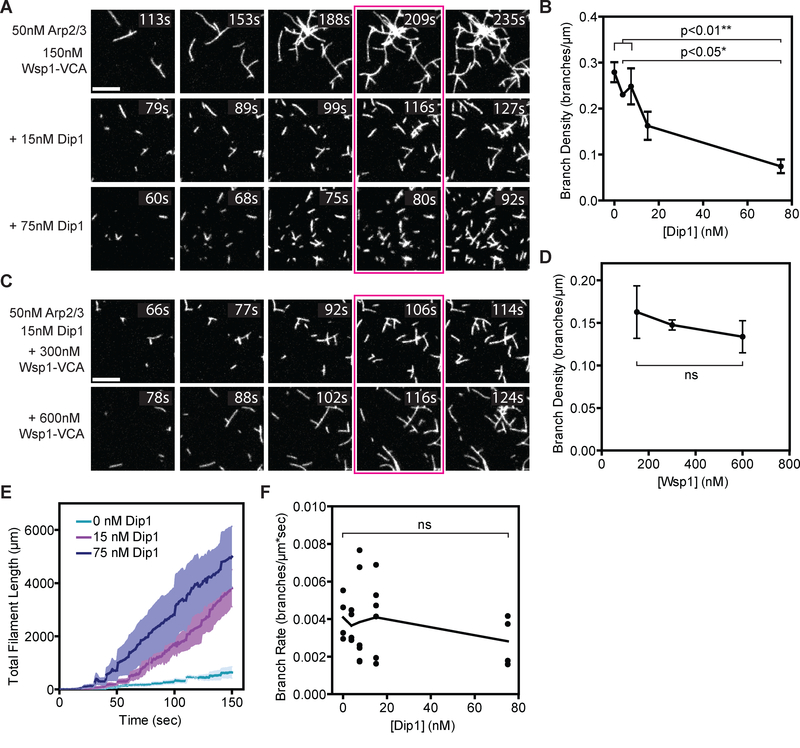
Figure 1: Arp2/3 complex preferentially nucleates linear actin filaments in the presence of both Dip1 and Wsp1.
A. TIRF microscopy images of actin polymerization assays containing 150 nM GST-Wsp1-VCA, 1.5 μM 33% Oregon Green-labeled actin, 50 nM SpArp2/3 complex and the indicated concentrations of Dip1. The reaction time is indicated in the upper right corner of each panel. Panels are aligned by total filament length in the full uncropped frame from which each panel is derived. The corresponding total filament length for each panel from left to right is 250, 500, 1000, 1500, and 2000 μm. Scale bar: 5 μm. B. Plot of the branch density versus Dip1 concentration for reactions as shown in Panel A. Branches were counted when the total filament length was 1500 μm (panels boxed in magenta in A). Error bars: SE from 4 to 6 regions of interest containing at least 130 filaments from 2–3 separate TIRF reactions. C. TIRF microscopy images of actin polymerization assays containing 15 nM Dip1, 1.5 μM 33% Oregon Green-labeled actin, 50 nM SpArp2/3 complex and indicated concentrations of GST-Wsp1-VCA. The reaction time is indicated in the upper right corner of each panel. Panels are aligned by total filament length as described in panel (A). Scale Bar: 5 μm. D. Plot of the branch density versus the concentration of GST-Wsp1-VCA as shown in panel C. Branches were counted when the total filament length was 1500 μm (panels boxed in magenta in C). Error Bars: SE from 4 to 6 regions of interest containing at least 340 total filaments from 2–3 separate TIRF reactions. E. Plot of total actin filament length in the field of view versus time for reactions described in panel (A) with the indicated concentration of Dip1. The standard error is calculated from the measurements of the full field of view from 2 or 3 reactions and is shown in a lighter shade around the means at each time point (dark lines). The increased polymer accumulation rate is due to faster nucleation in the Dip1-containing reactions, since Dip1 does not influence filament barbed end elongation rates [7,8]. F. Plot of the branch rate versus the concentration of Dip1 added to reactions as shown in panel (A). Measurements were made when the reaction reached a total filament length of 1500 μm. The time component of the rate is based on an extrapolation of the lifetime of the filament determined from filament lengths and the barbed elongation rate (see methods). Each point represents the average branching rate within a region of interest containing between 19 and 230 filaments. See also Figures S1–S2.

