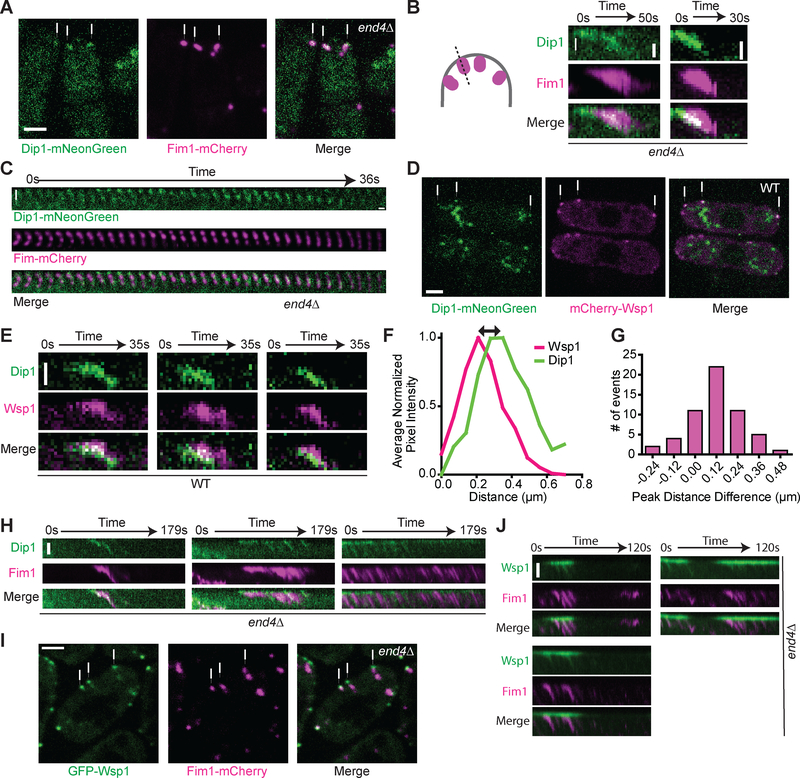
Figure 3: Localization of Dip1 and Wsp1 at wild type endocytic actin networks and treadmilling actin networks induced by deletion of END4.
A. Spinning disk confocal images of Dip1-mNeonGreen (green) and Fim1-mCherry (magenta) in end4Δ S. pombe cells. The white arrows indicate representative treadmilling actin networks. Scale bar: 2 μm. B. Kymographs showing Dip1-mNeonGreen (green) and Fim1-mCherry (magenta) signal in treadmilling actin networks in end4Δ cells. The kymographs were made from a one pixel-wide line drawn from the exterior of the cell into the cytoplasm as depicted in the cartoon. The top of each panel is the cortex and the white arrow shows the direction of internalization into the cytoplasm. Scale bar: 0.5 μm. C. Montage of Dip1-mNeonGreen (green) and Fim1-mCherry (magenta) signals in a treadmilling actin network in end4Δ cells. The interval between each tile is l second. Scale bar: 0.5 μm. D. Spinning disk confocal images of Dip1-mNeonGreen (green) and mCherry-Wsp1 (magenta) in wildtype S. pombe cells. The white arrows indicate representative endocytic patch sites. The large structures in the Dip1-mNeonGreen channel are autofluorescence (Figure S4). Scale bar: 2 μm. E. Kymographs of Dip1-mNeonGreen (green) and mCherry-Wsp1 (magenta) dynamics in wild type cells. The kymographs are generated as described in panel C. Scale Bar: 0.5 μm. F. Plot showing the average normalized pixel intensity of mCherry-Wsp1 and Dip1-mNeonGreen along a line drawn through an endocytic patch from the exterior of the cell into the cytoplasm as depicted in the cartoon in panel B. Measurements were made when the total Wsp1 was at its peak intensity. The peak pixel intensity was aligned to 0.2l μm, the average distance of the peak pixel intensity of Wsp1 from the cortex at this timepoint. Traces represent the average of l5 endocytic patches selected proportionally from the histogram in panel G. G. Histogram of the distance between the peak signals of mCherry-Wsp1 and Dip1-mNeonGreen, as depicted by the black arrow in panel F. Positive numbers correspond to patches in which Dip1 is further from the cortex than Wsp1. On average, Dip1-mNeonGreen peak signal is 120 nm further from the cortex than mCherry-Wsp1 peak signal. See Materials and Methods for additional details (n = 56 patches, one sample t-test p < 0.0001). H. Kymographs of Dip1-mNeonGreen (green) and Fim1-mCherry (magenta) at cortical sites with multiple actin treadmilling events in end4Δ cells. Scale Bar: l μm. I. Spinning disk confocal images of GFP-Wsp1 (green) and Fim1-mCherry (magenta) in end4Δ S. pombe cells. The white arrows indicate representative treadmills. Scale bar: 2 μm. J. Kymographs of GFP-Wsp1 (green) and Fim1-mCherry (magenta) at repetitively treadmilling comet tails in end4Δ cells. Scale bar: l μm. See also Figures S3–S4 and Videos S2–S4.

