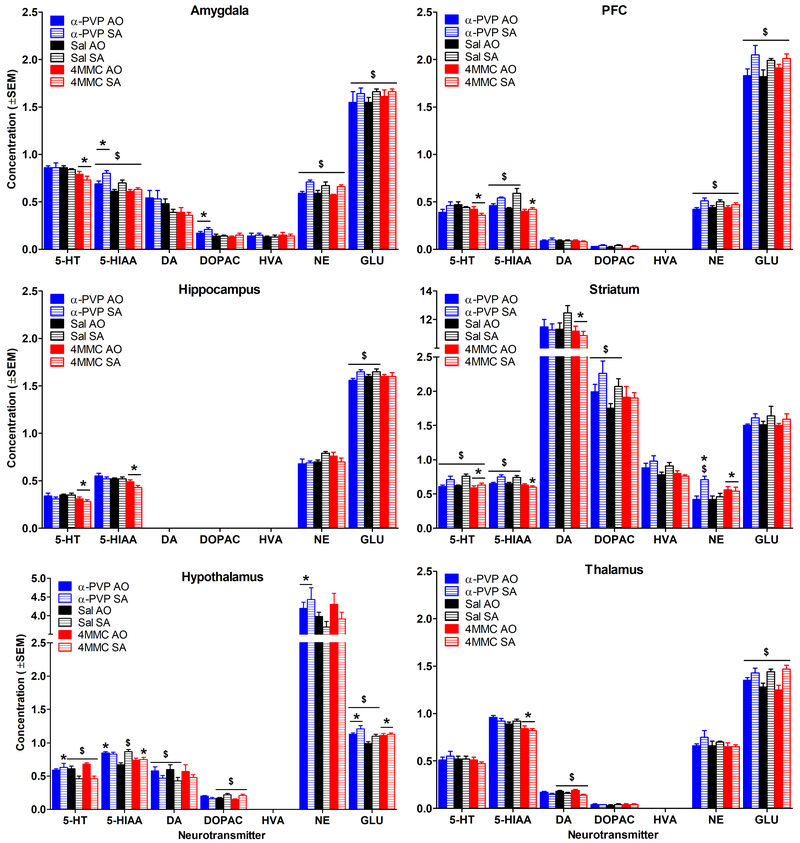
Figure 3.
Mean neurotransmitter and metabolite concentrations as a function of brain region. Concentration units are ng/ml for all analytes except for GLU which is shown in μg/ml. Note different y axis scale for hypothalamus and striatum. * indicates a significant difference from saline for the same duration (main effect or interaction), and $ indicates a significant difference from AO for the same drug/saline (main effect or interaction). Sal = saline. n=5-8/group for DA, DOPAC, and HVA in amygdala; n=3-8/group for DOPAC in PFC; n=7-8/group for all other neurotransmitters and metabolites.

