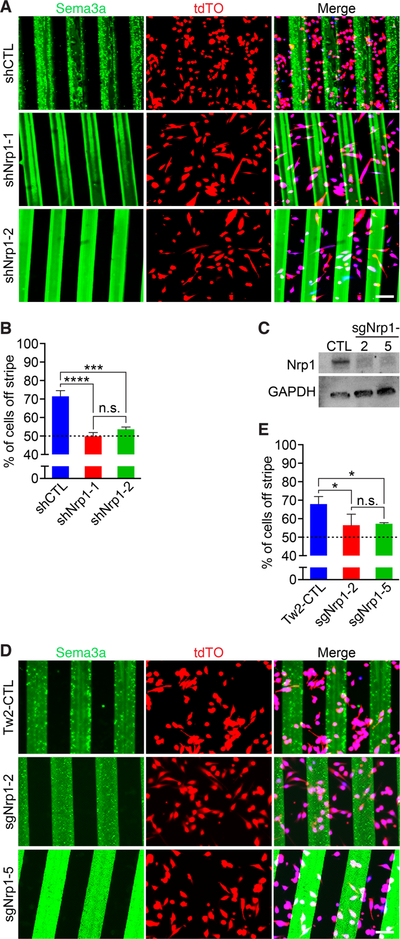
Figure 5. Nrp1 is necessary to drive repulsion of Tw2-MB from Sema3a stripes.
(A) Knockdown of Nrp1 by shRNA in Tw2-MB (red) abolished Sema3a avoidance. (Top) Control shRNA (shCtrl) infected Tw2-MB 1 day after seeding on Sema3a stripes (green). (Middle, Bottom) Tw2-MB overexpressing either shNrp1–1 or shNrp1–2 1-day after seeding on Sema3a stripes (green). Cells were co-stained with Hoechst (blue). Scale bar: 100 µm. (B) Quantification of Sema3a avoidance as the percent of cells residing off the stripe in Fig. 5A. The dashed line represents the baseline for cells unresponsive to Sema3a. Three separate fields were quantified for each sample with a total of 3 samples per cell type. ***: p < 0.0005, ****: p < 0.00005. (C) Western blot showing loss of NRP1 protein in Tw2-MB infected with sgRNAs targeting Nrp1. GAPDH was used as a loading control. (D) (Top) Control pLentiCrisprV2-infected Tw2-MB (red) 1 day after seeding on Sema3a stripes (green). (Middle, Bottom) Two separate Nrp1 sgRNA-infected Tw2-MB (sgNrp1–2 and sgNrp1–5) 1-day after seeding on Sema3a stripes (green). Cells were co-stained with Hoechst (blue). Scale bar: 100 µm. (E) Quantification of Sema3a avoidance as the percent of cells residing off the stripe in Fig. 5D. The dashed line represents the baseline for cells unresponsive to Sema3a. Three separate fields were quantified for each sample with a total of 3 samples per cell type. *: p < 0.05. See also Figure S5. Source data for 5B and E are provided in Supplementary Table 1.

