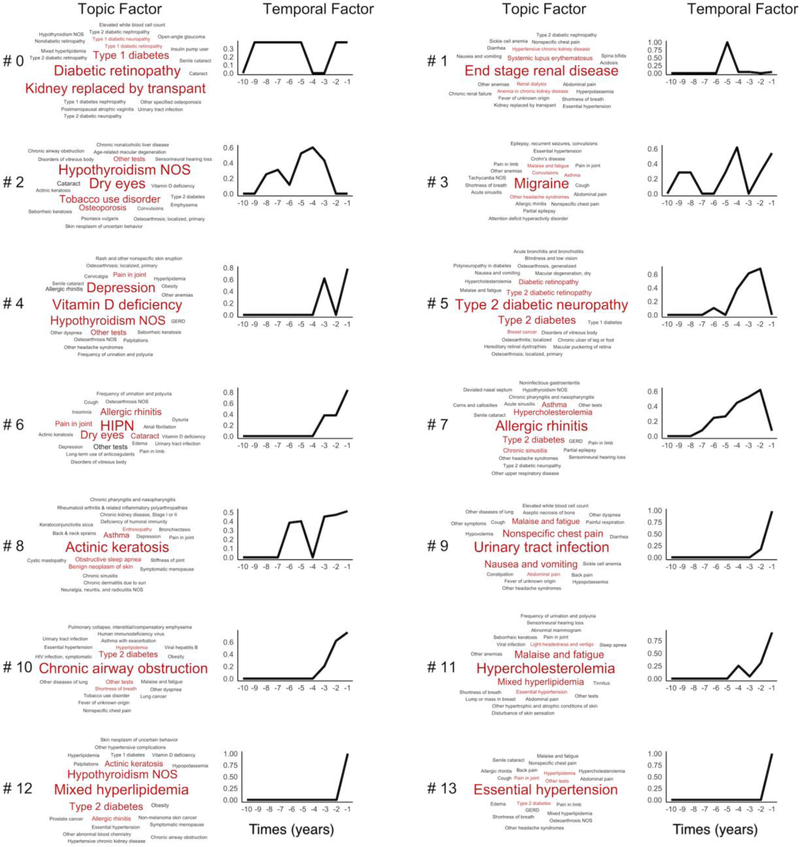
Figure 3.
Tensor factorization on 10 year-diagnoses prior to CVD diagnosis. Each topic contains the topic factor, represented by a word cloud and a time factor showing the time trend. The word size of a PheCode is proportional to its weight (i.e. influence) for the topic (from factor A), e.g. Essential hypertension has a larger influence than GERD within Topic #13. The x-axis on the line charts represent the years prior to the diagnosis of CVD, increasing from 10 years to 1 year prior to CVD. The y-axis represents the mathematical weights (from time factor B) for the respective topics for each year prior to the diagnosis of CVD. HIPN in Topic #6: Hereditary and idiopathic peripheral neuropathy.

