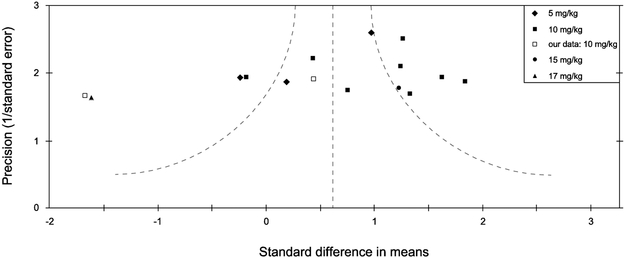
Figure 1.
Funnel plot “meta analysis” of a subset of 13 unstressed forced swim studies from Table 1. The abscissa is effect size which quantifies the difference in immobility between the (R,S)-ketamine and vehicle groups in a given study, whereas the ordinate is the “precision” also known as the inverse standard error, a measure of sample size. The curved lines represent the 95% confidence interval. Cohen’s d was used to determine effect sizes. Positive effect sizes represent decreases in immobility induced by (R,S)-ketamine, whereas negative values indicate increases in immobility on this drug. As noted in the legend, our own data (Fitzgerald et al. 2019) are depicted as open squares in this graph. This figure only includes studies of mice (various strains) at the 24 hour post-injection timepoint, in a moderate subanesthetic dose range between 5-20 mg/kg (see legend).

