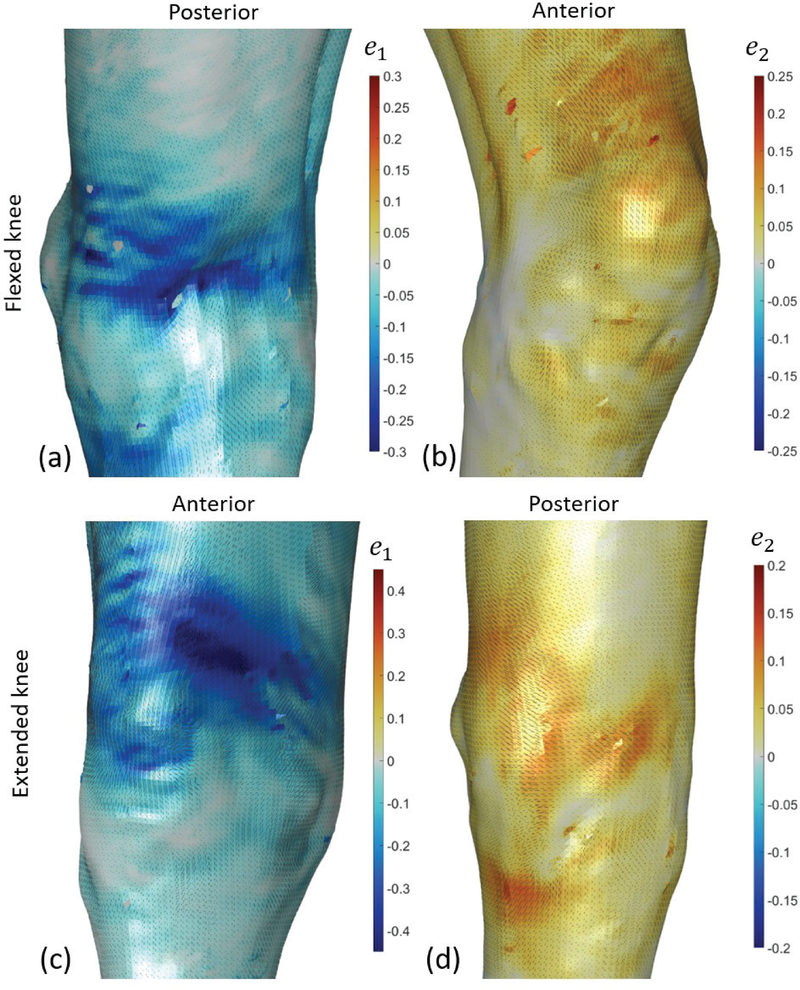
Fig. 6.
Eulerian strain measurements during knee flexion test. Two deformed configurations out of seven are plotted: most flexed in the top row (a,b) and most extended in the bottom row (c,d). The strains were calculated with respect to the reference configuration, which is not necessarily a stress-free configuration. The minimum and maximum Eulerian principal strain e1 and e2 are plotted on the left (a,c) and right (b,d) plots, respectively. Strain magnitudes are plotted as colors and their directions are plotted as black lines, with length proportional to their magnitude. The anatomical view showing the largest absolute values are shown for each subplot. All the results represent raw data. No kind of filtering or smoothing procedures were applied. Holes in the mesh appear where vertices could not be correlated reliably, such that the surface color from the opposite side of the surface is visible through the holes.

