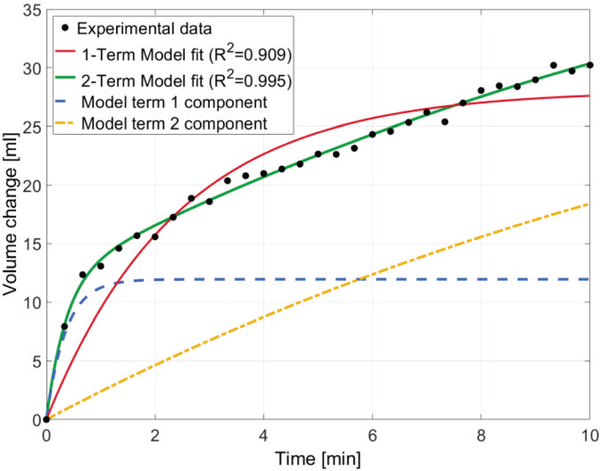
Fig. 7.
Residual limb volume change post-doffing plotted against time. The black data points represent experimental volume data computed directly from DIC data, the red and green solid lines represent the one and two-term exponential curve fits, respectively. The dashed blue and yellow lines represent the contribution of each model term to the overall two-term fit.

