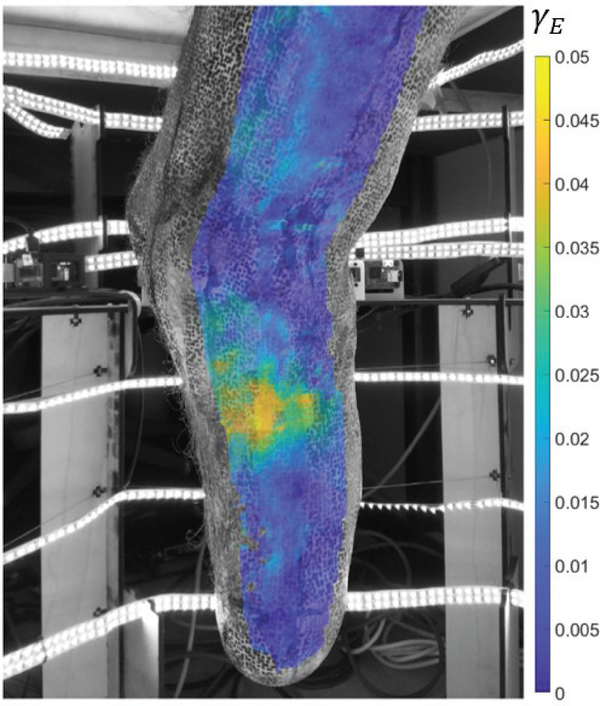
Fig. 9.
Maximum Green-Lagrangian shear strain map during muscle contraction. The image and strain results correspond to the maximum plantarflexion configuration. The largest strain values in this configuration were observed in the medial-posterior region of the residuum. 3D-DIC results from two adjacent camera-pairs which contain the same camera (pairs 5 and 6) are interlaid on the image captured by camera 6.

