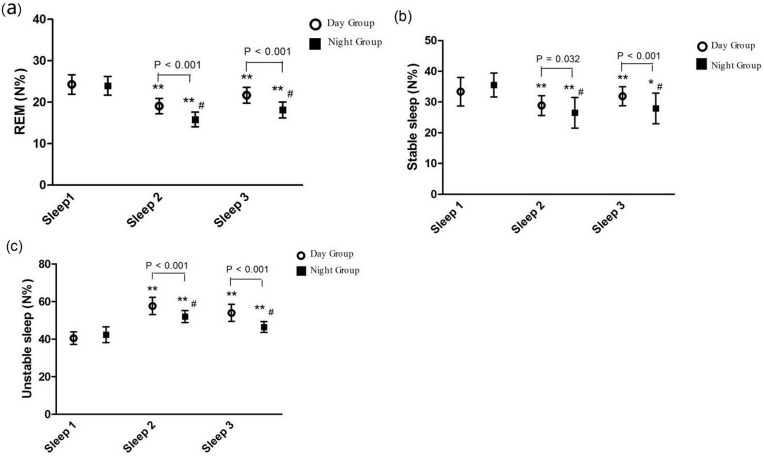
Figure 4.
Comparison of the percentage of sleep stages distribution between the Day Group and the Night Group. (A) REM; (B) Stable sleep; (C) Unstable sleep. REM: Rapid eye movement; Sleep 1: the night before surgery; Sleep 2: the first night after surgery; Sleep 3: the third night after surgery. In the same group, * vs Sleep 1: P < 0.05; ** vs Sleep 1: P < 0.001. At the same point, # vs the Day Group: P < 0.05.

