Figure 4.
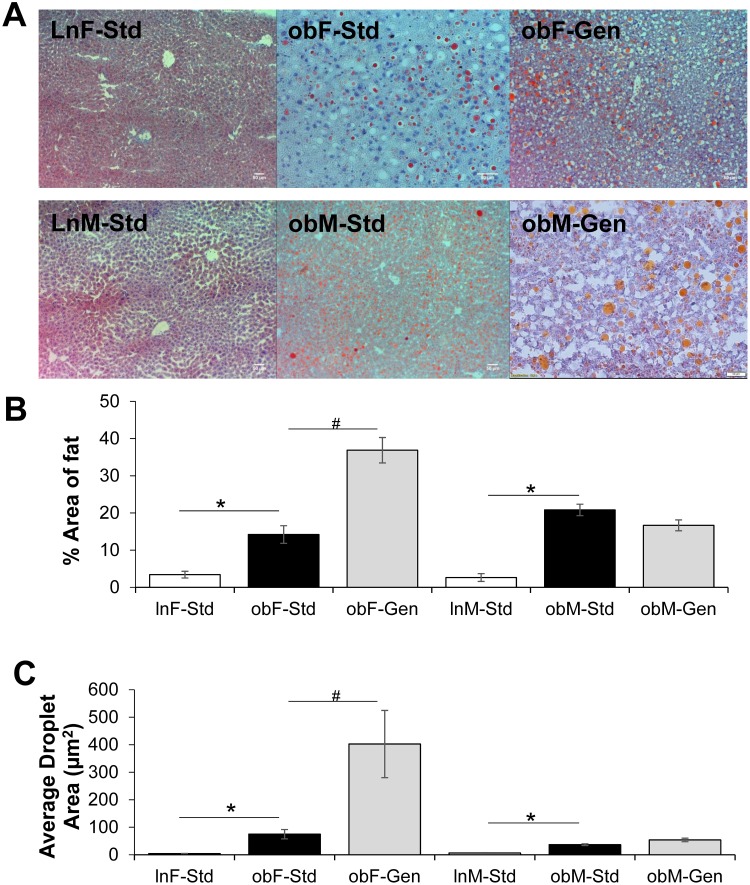
Effect of genistein on hepatic steatosis. (A) Representative images of hepatic sections stained with Oil-Red-O, for each of the groups. All images are at 10X. scale bar is 50 µm. (B) Percentage fat in liver. The % fat/liver section increased in ob/ob mice (solid bars), compared to leans (open bars). Genistein diet further increased % fat/liver section in female ob/ob mice, and was without effect in males (gray bars). (C) Average droplet area in liver. The average droplet area increased in ob/ob mice (solid bars), compared to leans (open bars) and genistein diet further increased droplet area in female ob/ob mice, and was without effect in males (gray bars). n=9–16. Values are mean ± SEM. *denotes significant difference from lean, P<0.05 and #denotes significant genistein-mediated effect P<0.05.

