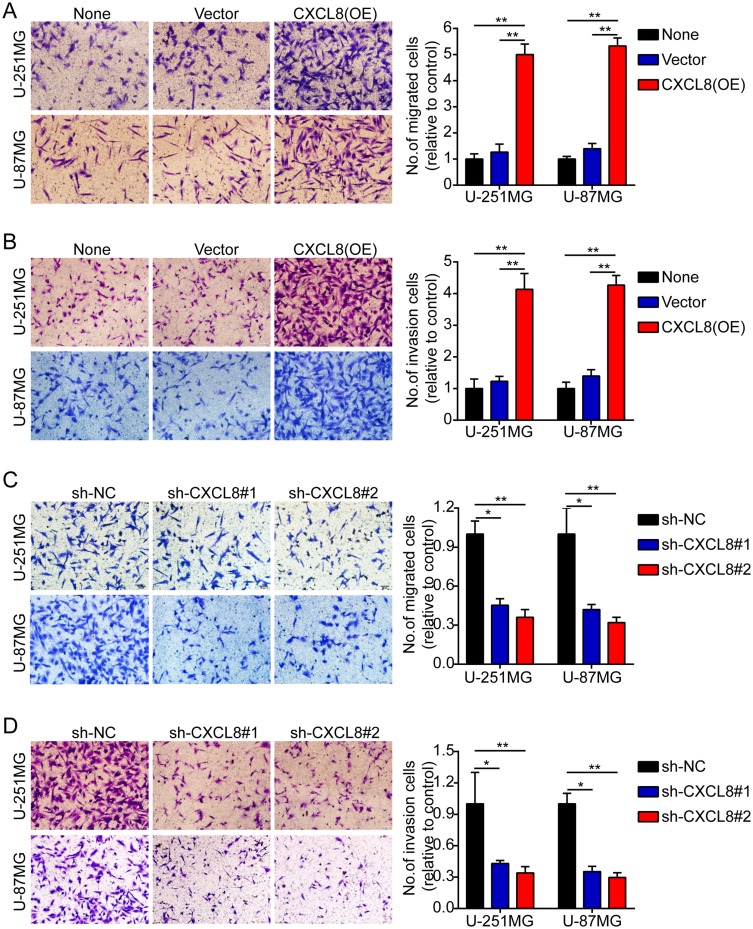
Figure 3.
High levels of CXCL8 promote glioma cells migration and invasion. (A–D). Representative images (left panels) and histogram quantification (right panels) of the Transwell migration (A, C) and invasion assays (B, D) with U-251MG and U-87MG cells. Statistical significance was assessed using one-way ANOVA followed by Dunnett’s tests for multiple comparisons. Scale bars: 50 μm. *p < 0.05 and **p < 0.01.

