Fig. 1.
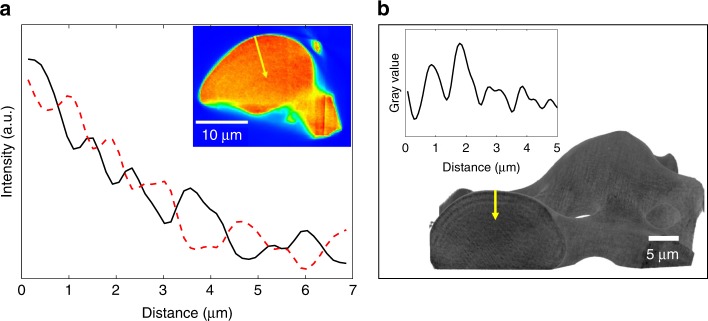
The layered structure revealed by tomography. a XRF tomography reconstruction slice across a lens (pixel size is 150 nm, red areas correspond to higher Ca content). Corresponding intensity line plot taken from the lens surface towards the center of the bulk (marked by a yellow arrow), shows the measured oscillations of the calcium signal (black) compared with theoretical schematic oscillations of the magnesium content (dashed red), perpendicular to the sample surface. b Typical nano-HT reconstructed dorsal arm plate (DAP) part, showing oscillations in mass-density (pixel size is 35 nm). Corresponding intensity line plot taken from the lens surface towards the center of the bulk (marked by a yellow arrow)

