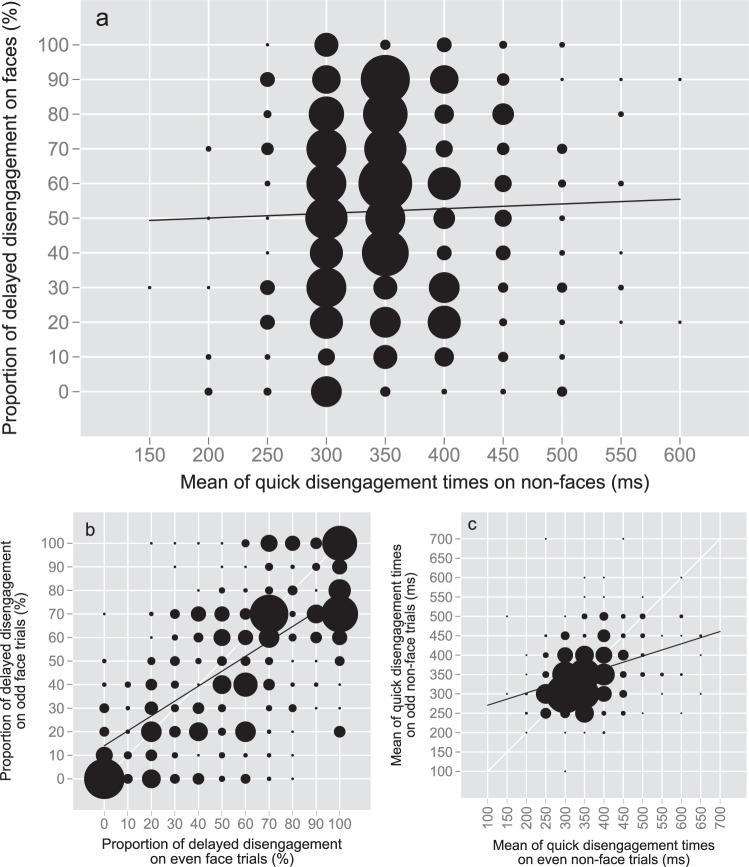
Figure 4.
Bubble plots on disengagement data for all studies pooled including participants with ≥3 observations for each variable. Circle size is the squared count of participants for each interval. Black line indicates linear fit. (a) Covariation of delayed disengagement from faces and oculomotor speed for non-face patterns, N = 550, rs = 0.04, BF10 = 0.09. (b) Odd-even split-half reliabilities of delayed disengagement from faces, N = 508, rs = 0.64, BF10 > 100. (c) Odd-even split-half reliabilities of oculomotor speed for non-face patterns, N = 408, rs = 0.34, BF10 > 100.

