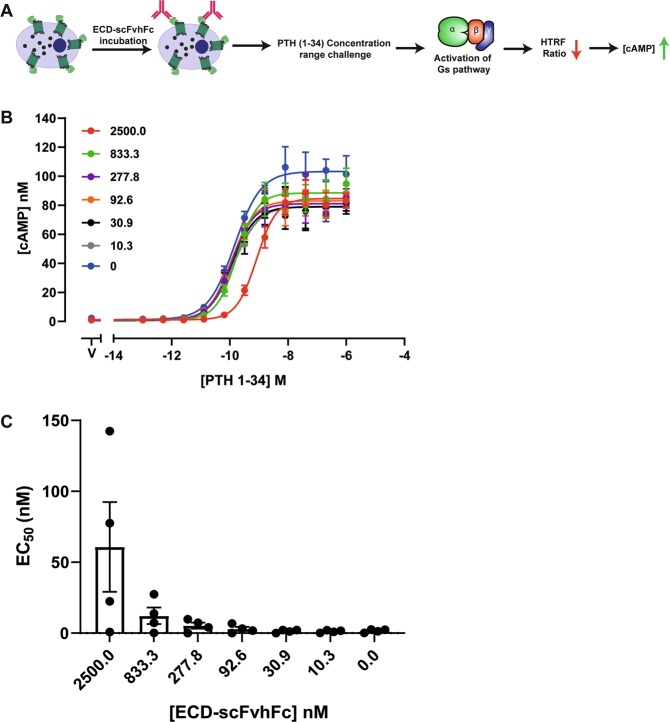
Figure 3.
cAMP antagonism by ECD-scFvhFc. (A) A schematic representation outlining the effect of ECD-scFvhFc on the EC50 of PTH (1–34) mediated cAMP production. (B) A representative plot showing the effect of ECD-scFvhFc on the PTH (1–34) concentration-response curves. PTH1R expressing CHOK-1 cells were incubated with different concentrations of ECD-scFvhFc (indicated by the different coloured traces) followed by incubation with a concentration-range of PTH (1–34). The cAMP concentration was calculated using cAMP standard curve and each data point represents mean and standard deviation from quadruplicate measurements. (C) Plot summarising the calculated EC50 from four separate experiments. Bars represent means ± SEM.

