
Fig. 2.
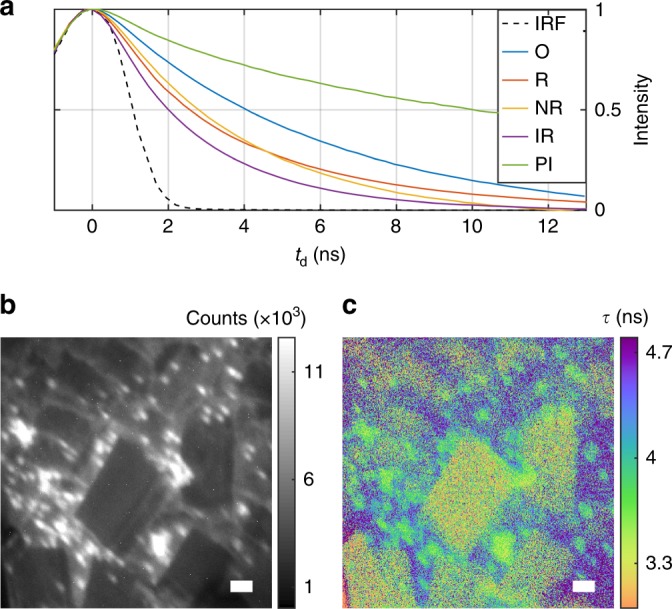
Multi-label FLIM. a Direct measurement of fluorescence decays obtained by sweeping gate delay time td for orange (O, 4.9 ns), red (R, 3.4 ns), nile red (NR, ~3.1 ns), infrared (IR, 2.3 ns) and propidium iodide (PI, 14 ns) beads. Fitted decay constants τ are given. The measured Gaussian instrument response function (IRF) is plotted in black. b Intensity image of a three-label wide-field sample of orange, nile red, and infrared beads (labels strongly overlap spatially). c Lifetime image reveals spatial distribution of the labels. Lifetime is measured by fitting the decay traces at each pixel (scale bars 10 μm)