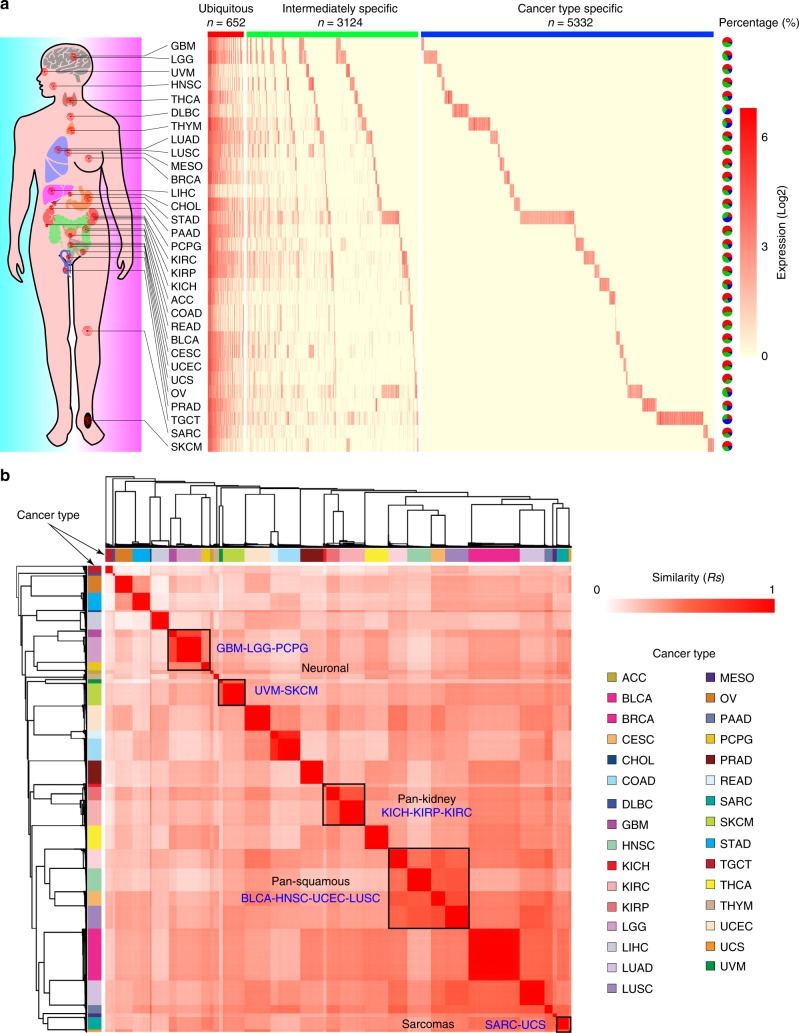
Fig. 1.
Expression landscape of eRNAs in human cancers. a Expression profile of eRNA in human cancers. Red, green and blue bars, respectively, denote ubiquitous, intermediately specific and cancer-type-specific eRNAs. Pie charts reflect the percentage of each category of eRNAs in each cancer type. Abbreviation of each cancer type is listed in Supplementary Data 1. Scale bar denotes the expression level of eRNAs (log2). Organ icons made by Freepik (https://www.freepik.com/). b Expression similarity among tumor samples. Color bar denotes each cancer type. Scale bar denotes the similarity of eRNA expression among TCGA samples

