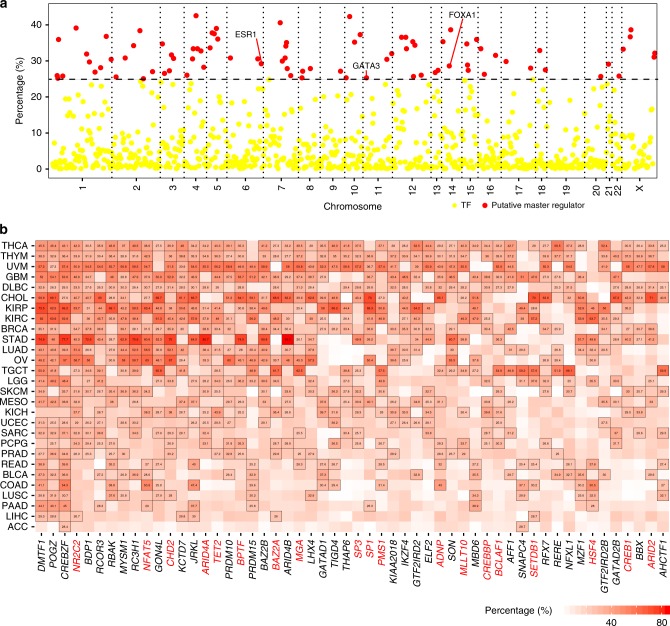
Fig. 2.
Putative regulation of eRNA biogenesis in cancer. a Putative regulators of eRNAs in BRCA. Each dot represents one transcription factor (TF). Red dots denote putative master regulators significantly correlated to ≥25% of individual eRNAs. Three well-known TFs (ESR1, GATA3, and FOXA1) are highlighted. X-axis is chromosome; y-axis is percentage of eRNAs correlated to each TF. b General putative master regulators in human cancers. X-axis is symbol of putative master regulator and y-axis is cancer type. General putative master regulators involved in genomic instability are marked by red. Number in cells denotes the percentage of eRNAs regulated by each master regulator. Scale bar denotes percentage of eRNA correlated with TFs (x axis) across cancer types (y axis)

